Moving Company Income Statement Template
Track local move revenue, long-distance jobs, crew labor, fuel, and storage fees in one income statement built for moving companies and owner-operators.
What's Inside This Moving Company Income Statement Template
This template includes 4 worksheets, each designed for a specific part of your moving company financial workflow:
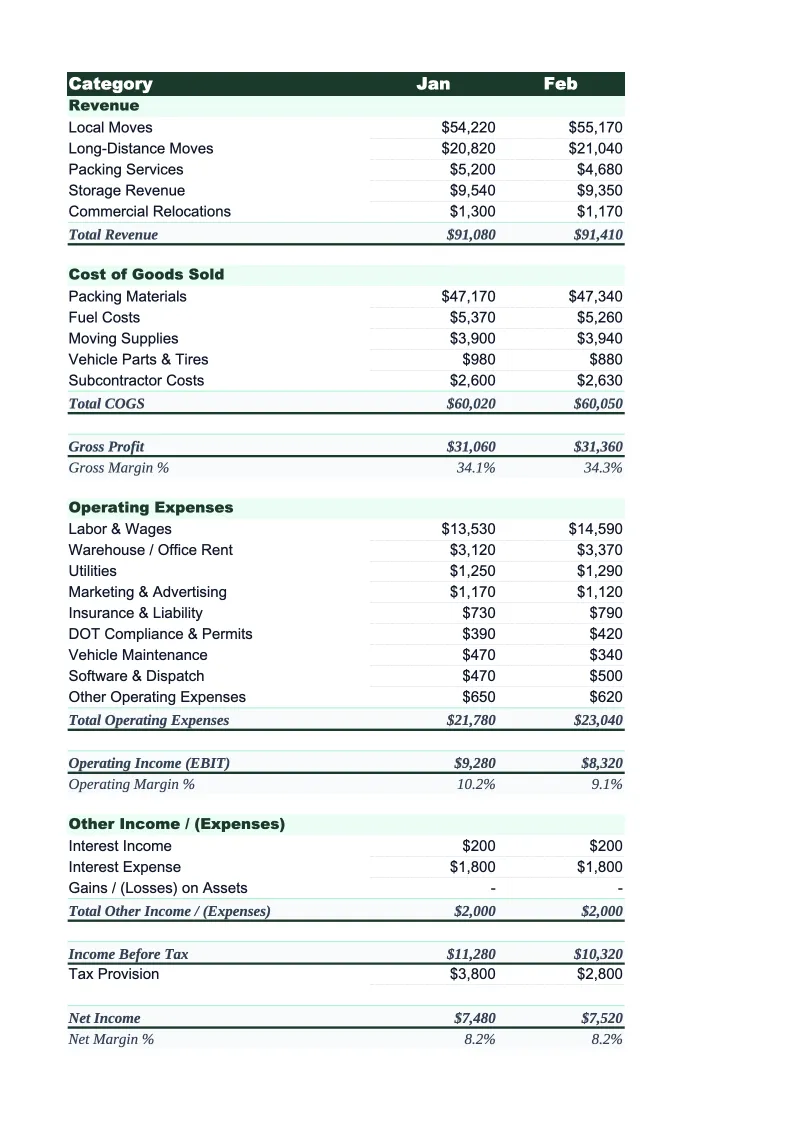
Monthly Income Statement
The core worksheet where you report each month's revenue and expenses using moving company-specific line items.
Annual Summary
A 12-month rollup that pulls from each monthly sheet automatically, giving you a full-year view of revenue by service type, expenses by category, and net income across the year.
Per-Job Analysis
A dedicated worksheet that calculates average revenue per job, average crew hours per job, labor cost per job, and direct cost as a percentage of job revenue for each month and for the full year.
Dashboard
A visual summary with pre-built charts showing monthly revenue trends, expense breakdowns by category, gross margin by service type, and crew labor percentage over time.
Moving Company Income Statement Template Features
- Revenue broken out by local moves, long-distance, packing, storage, and valuation coverage
- Crew labor and driver costs tracked separately from overhead
- Per-job analysis: average job value, labor hours per job, and direct cost percentage
- Monthly income statement with 12-month annual rollup
- Crew labor percentage and gross margin KPIs auto-calculated
- Visual dashboard with seasonal revenue trends and expense breakdown
How to Use This Moving Company Income Statement Spreadsheet
Getting started takes about 15 minutes. Download the .xlsx file and open it in Excel or Google Sheets — no macros or plugins required. Start with the Monthly Income Statement sheet: review the pre-loaded revenue and expense categories and adjust any line items that don't match your operation. A two-truck local mover will use a simpler setup than a company running long-distance and storage; remove the categories you don't use and rename any that need to match your chart of accounts.
Once the categories look right, enter your revenue and expenses for the current month. Pull revenue figures from your job management software or dispatch records, and pull costs from your fuel receipts, payroll reports, and materials invoices. Enter your total job count by type in the Per-Job Analysis sheet and the average job value and labor hour calculations update automatically. Copy the monthly structure forward for future months as you go — the Annual Summary pulls from each monthly sheet without any extra setup.
15 minutes from download to your first income statement
Download the template, plug in your job revenue and crew costs, and see your moving company's full financial picture — monthly statement, annual rollup, and per-job analysis included.
Why Every Moving Company Needs an Income Statement Template
Moving is a low-margin business that lives and dies on crew efficiency and seasonal cash management. Gross margins typically run 25–45%, but after crew labor (usually 25–35% of revenue by itself), truck costs, fuel, insurance, and marketing, net margins settle between 7–10%. What makes it harder is the seasonality: 60% of annual revenue arrives between May and August, with June being the single busiest month, and November through February can be so slow that summer profits fund winter operations almost entirely. Most moving company owners track revenue well — they know their job count and top-line numbers — but they don't see the full cost picture broken out by category until tax season, which is too late to change anything.
A moving company income statement needs to reflect how the business actually generates and spends money. On the revenue side, local moves and long-distance jobs have different margin profiles: local moves are hourly and more predictable, while long-distance moves carry higher revenue per job but also higher direct costs (fuel, SIT fees, cross-country insurance). Packing services and valuation coverage sold are high-margin add-ons that improve job economics without adding truck costs. On the expense side, crew labor is the single biggest variable cost and the one most directly tied to how jobs are estimated and managed — crews that run over estimated hours are the fastest way to turn a profitable job into a break-even one.
Moving Company Industry at a Glance
Financial templates built for moving companies — from local movers to long-distance carriers. Pre-loaded with job-based billing, labor tracking, and the KPIs that matter for seasonal service businesses.
Revenue Drivers
- Local moves (hourly billing)
- Long-distance moves (flat-rate/weight-based)
- Packing services
- Storage and SIT fees
- Specialty item handling (pianos, safes)
- Valuation and liability coverage
Key Cost Categories
- Crew labor (field)
- Truck costs and fuel
- Insurance (cargo, liability, workers comp)
- Packing materials
- Marketing and lead generation
- Administrative labor
- Equipment maintenance
Typical Margins
Gross: 25-45% · Net: 7-10%
Seasonality
Peak season May–August accounts for ~60% of annual moves. June is the single busiest month. November–February is slowest; cash reserves built in summer cover winter operations.
Key Performance Indicators
Moving Company Income Statement Template FAQ
More Moving Company Templates
Moving Company Balance Sheet Template for Excel
$29
Moving Company Budget Template for Excel
$29
Moving Company Business Plan Template for Excel
$39
Moving Company Cash Flow Template for Excel
$29
Moving Company Expense Tracker Template for Excel
$29
Moving Company Financial Model Template for Excel
$29
Moving Company Invoice Template for Excel
$29
Moving Company KPI Dashboard Template for Excel
$29
Moving Company P&L Template for Excel
$29
Moving Company Pro Forma Template for Excel
$29
Moving Company Project Budget Template for Excel
$29
Moving Company Sales Forecast Template for Excel
$29
Moving Company Valuation Template for Excel
$29
More Income Statement Templates
Accounting Firm Income Statement Template for Excel
$29
Auto Repair Income Statement Template for Excel
$29
Car Wash Income Statement Template for Excel
$29
Church Income Statement Template for Excel
$29
Cleaning Service Income Statement Template for Excel
$29
Coffee Shop Income Statement Template for Excel
$29
Moving Company Income Statement Template
$29