Moving Company Sales Forecast Template
Project your moving company's revenue by job type, average job value, and monthly volume — with seasonal adjustments, scenario planning, and actual vs forecast tracking built in.
What's Inside This Moving Company Sales Forecast Template
This template includes 6 worksheets, each designed for a specific part of your moving company financial workflow:
Assumptions
The central driver sheet that powers every calculation in the model.
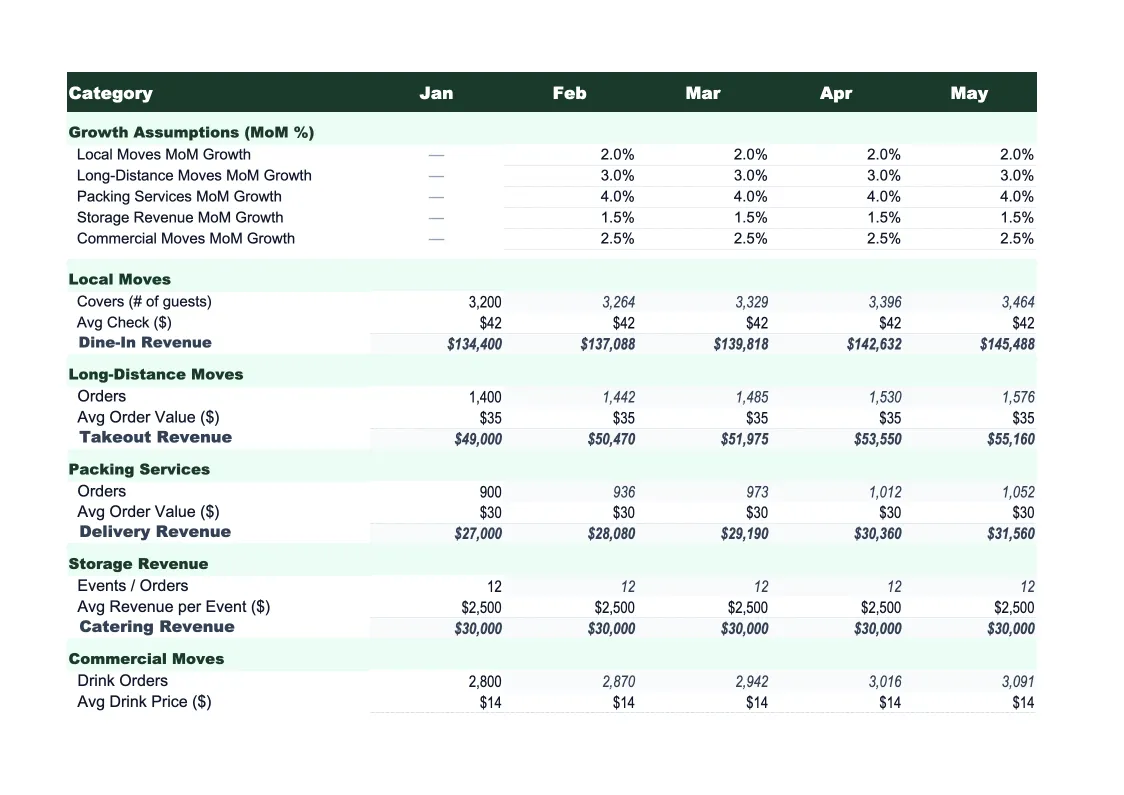
Monthly Forecast
The core projection worksheet showing 12 months of projected revenue by service line — local moves, long-distance moves, packing services, specialty item handling (pianos, safes, art), valuation and liability coverage upsells, and storage fees.
Annual Summary
A full-year rollup presenting total projected revenue by service line for the entire forecast period, with month-by-month columns and annual totals.
Actual vs Forecast
Enter your actual monthly revenue figures by service line after each month closes, and the sheet calculates dollar and percentage variance against your projections.
Scenario Comparison
Three side-by-side forecasts — base case, upside, and downside — built from distinct assumption sets.
Dashboard
A visual summary with pre-built charts pulling from the Monthly Forecast and Actual vs Forecast sheets: monthly revenue by service line (stacked bar), actual vs forecast trend line, revenue mix by service type (pie chart), and average job value trend over the forecast period.
Moving Company Sales Forecast Template Features
- Driver-based model: job volume × average job value × seasonal multiplier
- Revenue split by service type (local, long-distance, packing, storage, specialty)
- Monthly seasonality factors pre-set for moving industry's May–August peak
- Three-scenario comparison (base, upside, downside)
- Actual vs forecast tracker with rolling accuracy score
- Visual dashboard with service mix and monthly revenue charts
How to Use This Moving Company Sales Forecast Spreadsheet
Start with the Assumptions sheet — it drives everything else. Enter your average monthly job counts by service type (local moves, long-distance, packing-only), the average job value for each, and your expected growth rate. If you have last year's data from your job management software or accounting system, use those actuals as the baseline — it takes about 20 minutes to enter initial assumptions and review whether the resulting projections feel right. The seasonality multipliers are pre-loaded with standard moving industry patterns, but adjust them to match your market if you know your area peaks differently.
Once your assumptions are in, review the Monthly Forecast sheet to check whether the monthly revenue figures look realistic given your truck and crew capacity. The Annual Summary includes job count totals alongside revenue — cross-check those against how many jobs your crews can physically complete per month at your current staffing level. Then fill out the Scenario Comparison sheet: set a conservative downside (maybe 20% fewer jobs in summer, a shorter peak) and a reasonable upside, and check whether the range reflects what could actually happen. This step takes another 20 minutes but makes the forecast far more useful for planning cash reserves and hiring timing.
15 minutes from download to your first revenue forecast
Download the template, plug in your job volume and average job value, and see your moving company's projected revenue — month by month, service line by service line.
Why Every Moving Company Needs a Sales Forecast Template
Moving company revenue is one of the most seasonal of any service business. Peak season — May through August — typically accounts for 55–65% of annual revenue for most movers, with June being the single highest-volume month as leases turn and families relocate between school years. That concentration creates a forecasting problem: a 10% shortfall in peak season volume can wipe out a full quarter's planned profit, because the fixed costs (trucks, insurance, year-round staff) don't shrink with revenue in the slow months. Without a structured forecast, most moving company owners don't see the problem coming until they're already in it.
A moving company sales forecast is most useful when it separates revenue by job type rather than treating all moves as interchangeable. Local moves billed hourly have predictable per-crew-hour economics but high volume variance depending on lead flow and booking rate. Long-distance moves are fewer in number but much higher in average job value — often $3,000–$8,000+ — and are booked further in advance, making them more forecastable. Packing services, valuation coverage, and specialty item handling are upsell revenue streams that depend heavily on sales execution at the point of booking, not just job volume. Forecasting these separately surfaces which streams are actually growing and which are being left on the table.
Moving Company Industry at a Glance
Financial templates built for moving companies — from local movers to long-distance carriers. Pre-loaded with job-based billing, labor tracking, and the KPIs that matter for seasonal service businesses.
Revenue Drivers
- Local moves (hourly billing)
- Long-distance moves (flat-rate/weight-based)
- Packing services
- Storage and SIT fees
- Specialty item handling (pianos, safes)
- Valuation and liability coverage
Key Cost Categories
- Crew labor (field)
- Truck costs and fuel
- Insurance (cargo, liability, workers comp)
- Packing materials
- Marketing and lead generation
- Administrative labor
- Equipment maintenance
Typical Margins
Gross: 25-45% · Net: 7-10%
Seasonality
Peak season May–August accounts for ~60% of annual moves. June is the single busiest month. November–February is slowest; cash reserves built in summer cover winter operations.
Key Performance Indicators
Moving Company Sales Forecast Template FAQ
More Moving Company Templates
Moving Company Balance Sheet Template for Excel
$29
Moving Company Budget Template for Excel
$29
Moving Company Business Plan Template for Excel
$39
Moving Company Cash Flow Template for Excel
$29
Moving Company Expense Tracker Template for Excel
$29
Moving Company Financial Model Template for Excel
$29
Moving Company Income Statement Template for Excel
$29
Moving Company Invoice Template for Excel
$29
Moving Company KPI Dashboard Template for Excel
$29
Moving Company P&L Template for Excel
$29
Moving Company Pro Forma Template for Excel
$29
Moving Company Project Budget Template for Excel
$29
Moving Company Valuation Template for Excel
$29
More Sales Forecast Templates
Moving Company Sales Forecast Template
$29