Moving Company KPI Dashboard Template
Track every metric that matters for your moving business — job volume, crew utilization, claims ratio, and revenue per truck — all in one pre-built Excel dashboard.
What's Inside This Moving Company KPI Dashboard Template
This template includes 6 worksheets, each designed for a specific part of your moving company financial workflow:
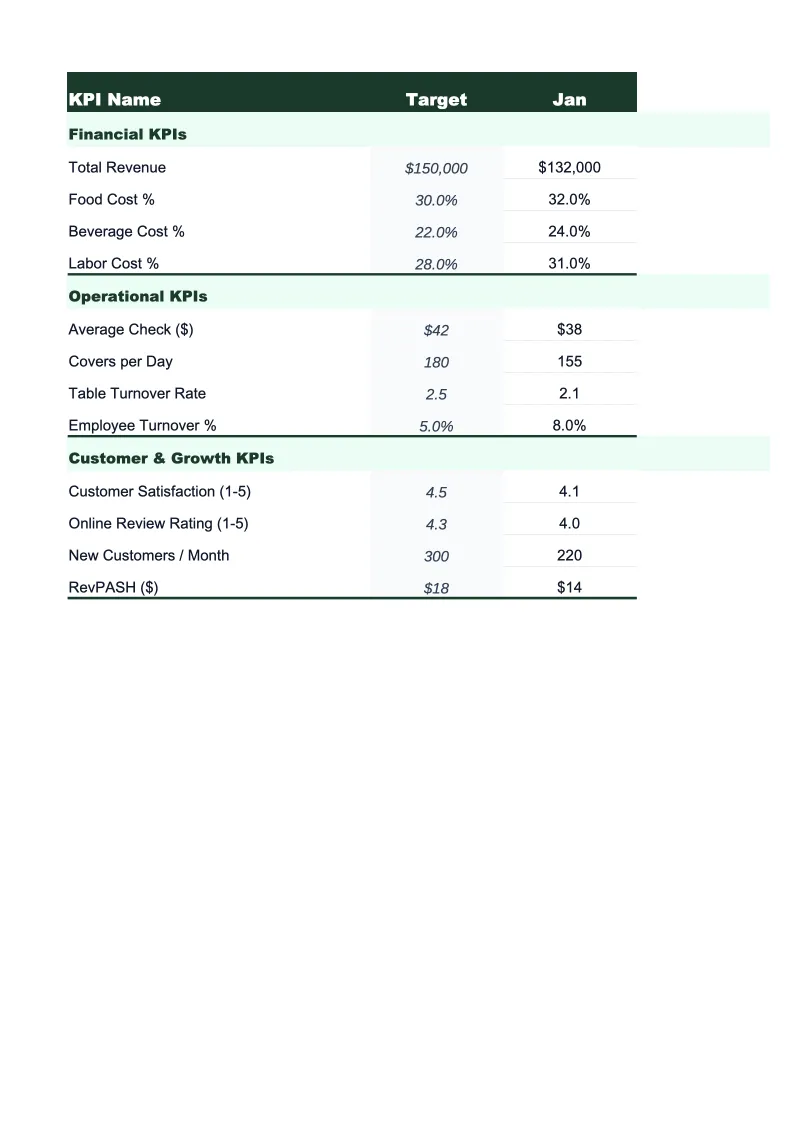
KPI Dashboard
The main dashboard summarizes your moving company's performance across every major dimension on a single screen.
Monthly KPI Input
The data entry sheet where you record actual figures each month.
Operational KPIs
This sheet calculates and tracks the day-to-day operational metrics that determine whether your crews and trucks are running efficiently.
Financial KPIs
A detailed breakdown of the financial metrics that drive profitability.
Sales & Lead Metrics
Tracks your lead pipeline from first contact to completed job.
Claims & Quality
Moving companies live and die by their claims ratio.
Moving Company KPI Dashboard Features
- Pre-built KPIs: crew utilization, average job value, claims ratio, revenue per truck
- Color-coded status indicators — green/yellow/red vs. industry benchmarks
- 12-month trend charts for revenue, margin, and crew utilization
- Lead-to-booking funnel metrics with close rate and cancellation tracking
- Claims tracking with payout history and revenue percentage calculation
- Seasonal performance view — compare peak months (Jun–Aug) vs. off-season
How to Use This Moving Company KPI Spreadsheet
Download the file and open it in Excel or Google Sheets — no macros or setup required. Start with the Monthly KPI Input sheet and review the pre-built fields. Most match standard moving company dispatch and payroll reporting, so you should be able to populate the current month in about 20 minutes using your dispatch software export and payroll summary. If you use a platform like ServiceTitan, Granot, or MoversTech, those typically export the job volume and revenue figures you need. The first month is the hardest — after that, it's a standing 20-minute task.
Once you've entered data for one or two months, the KPI Dashboard and trend charts will start to show useful information. Set your own targets in the Monthly KPI Input sheet for the metrics you care most about: crew utilization, average job value, claims ratio, and booking/close rate are the four that tend to drive the most operational decisions at growing moving companies. The color-coded indicators on the dashboard will tell you at a glance whether each KPI is on track, trending in the right direction, or needs attention — without reading through individual cells.
15 minutes from download to your first moving company KPI report
Download the template, enter last month's job data, and see your crew utilization, claims ratio, and average job value on a single dashboard.
Why Every Moving Company Needs a KPI Dashboard
Most moving companies track revenue and jobs completed, but those two numbers alone won't tell you if the business is actually healthy. A month with high revenue and low average job value might mean you're filling the schedule with small local moves that don't cover truck costs. A crew utilization rate of 85% looks great until you realize it's driven by overtime that's eating your margin. The KPIs that separate well-run moving companies from struggling ones are the ratios — labor as a percentage of revenue, claims as a percentage of revenue, and close rate on inbound leads — not the raw numbers.
The benchmarks for moving companies are well-established. Crew labor should run 30–35% of revenue in a healthy operation; anything above 40% signals inefficient routing, high overtime, or a pricing problem. Claims ratio should stay below 1% of revenue — above that, you're either under-investing in training and equipment, or your crew-to-job assignments need review. Booking/close rate from direct inbound leads should be 20–30%; if it's lower, the issue is usually quote responsiveness time or price competitiveness. Average job value in the $1,000–1,500 range for local moves and $4,000–8,000 for long-distance is typical, but what matters is whether yours is trending up or down over time.
Moving Company Industry at a Glance
Financial templates built for moving companies — from local movers to long-distance carriers. Pre-loaded with job-based billing, labor tracking, and the KPIs that matter for seasonal service businesses.
Revenue Drivers
- Local moves (hourly billing)
- Long-distance moves (flat-rate/weight-based)
- Packing services
- Storage and SIT fees
- Specialty item handling (pianos, safes)
- Valuation and liability coverage
Key Cost Categories
- Crew labor (field)
- Truck costs and fuel
- Insurance (cargo, liability, workers comp)
- Packing materials
- Marketing and lead generation
- Administrative labor
- Equipment maintenance
Typical Margins
Gross: 25-45% · Net: 7-10%
Seasonality
Peak season May–August accounts for ~60% of annual moves. June is the single busiest month. November–February is slowest; cash reserves built in summer cover winter operations.
Key Performance Indicators
Moving Company KPI Dashboard Template FAQ
More Moving Company Templates
Moving Company Balance Sheet Template for Excel
$29
Moving Company Budget Template for Excel
$29
Moving Company Business Plan Template for Excel
$39
Moving Company Cash Flow Template for Excel
$29
Moving Company Expense Tracker Template for Excel
$29
Moving Company Financial Model Template for Excel
$29
Moving Company Income Statement Template for Excel
$29
Moving Company Invoice Template for Excel
$29
Moving Company P&L Template for Excel
$29
Moving Company Pro Forma Template for Excel
$29
Moving Company Project Budget Template for Excel
$29
Moving Company Sales Forecast Template for Excel
$29
Moving Company Valuation Template for Excel
$29
More KPI Dashboard Templates
Moving Company KPI Dashboard Template
$29