Moving Company Financial Model Template
Model your moving company's full financial picture — job volume, crew costs, seasonal cash flow, and 3-year projections — in one connected workbook built for the moving industry.
What's Inside This Moving Company Financial Model
This template includes 6 worksheets, each designed for a specific part of your moving company financial workflow:
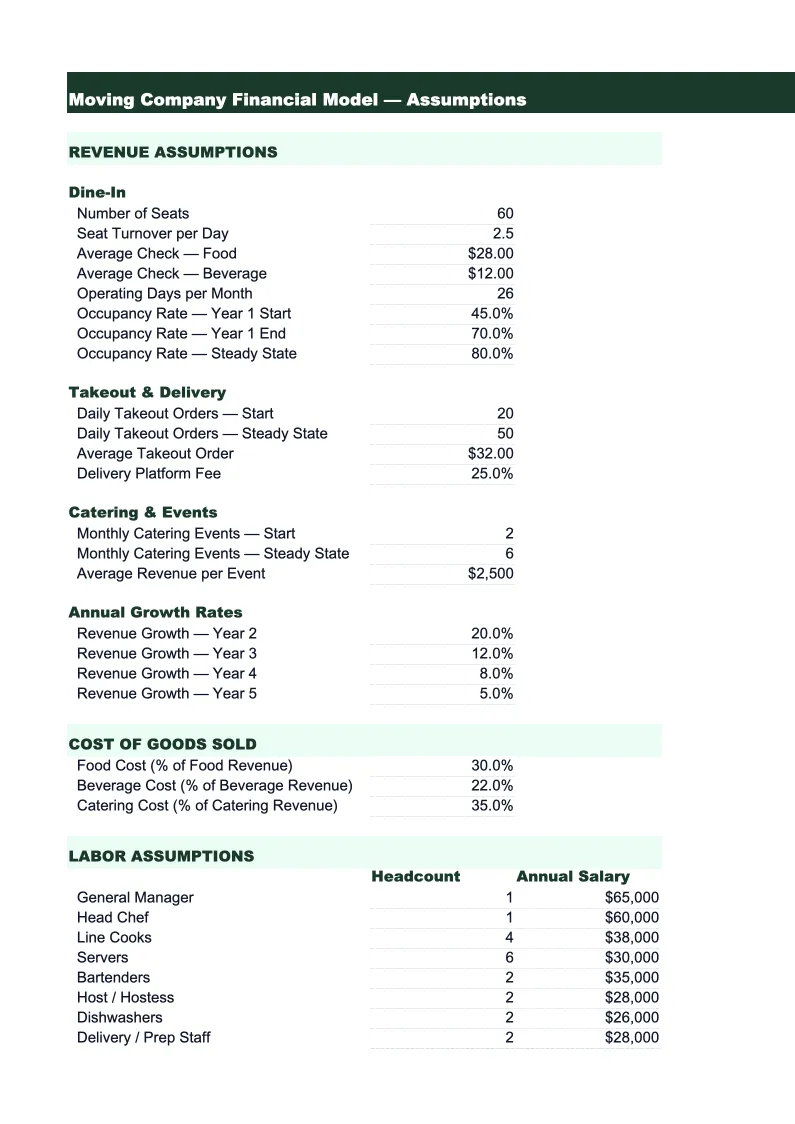
Assumptions
The control panel for the entire model.
Revenue Projections
A month-by-month revenue build over 36 months, broken out by service line: local moves (hourly billing), long-distance moves (flat-rate), packing services, storage and short-term storage (SIT) fees, specialty handling (pianos, safes, antiques), and valuation coverage.
P&L
A 36-month profit and loss statement built around the moving industry cost structure.
Cash Flow
A monthly cash flow statement that reflects how moving company revenues and expenses actually hit your bank account.
Balance Sheet
A simplified projected balance sheet showing assets (cash, accounts receivable, equipment at book value), liabilities (truck loans, insurance payables, any lines of credit), and owner's equity at each year-end.
KPI Dashboard
A single-page visual summary of the metrics that matter in the moving business.
Moving Company Financial Model Features
- Revenue build by job type: local hourly, long-distance flat-rate, packing, storage, and specialty
- Seasonal demand multipliers pre-configured for peak May–August and winter slow season
- Crew labor cost model based on hours per job and field staff headcount
- 36-month cash flow with minimum cash threshold alerts for winter planning
- KPI dashboard tracking crew utilization, average job value, and packing attach rate
- Fleet expansion scenario: model the impact of adding trucks on revenue and cash flow
How to Use This Moving Company Financial Spreadsheet
Start in the Assumptions sheet — it's the only sheet you need to edit to get a working model. Enter your current number of trucks and crews, your average local job value, average long-distance job value, and how many jobs each crew completes per month during peak and off-peak periods. Add your crew labor cost per hour, fuel costs per job, and fixed overhead items like rent and insurance. Most moving company owners can fill this in within 20 minutes using last year's QuickBooks report or bank statements.
Once your assumptions are in, review the Revenue Projections and P&L sheets. Check that the seasonal pattern looks right for your market — the template defaults to standard national seasonality, but if your local market peaks differently (college towns peak in August, for example), adjust the seasonal multipliers in the Assumptions sheet. Look at the gross margin percentage on the P&L; if it's outside the 25–45% range typical for the industry, your job pricing or labor cost inputs may need adjusting.
15 minutes from download to your first moving company projection
Download the template, enter your job volume and crew costs, and see your moving company's full financial picture — revenue, margins, and cash flow — for the next 3 years.
Why Moving Companies Need a Financial Model
Moving companies have an unusual financial challenge: they generate most of their revenue in four to five months, then run operations for twelve. The average moving company earns roughly 60% of its annual revenue between May and August, with June being the single highest-volume month in most markets. That means cash management isn't just an accounting task — it's what determines whether you make payroll in February. Most small moving companies that fail don't fail because they lack customers; they fail because they don't model the cash curve and run out of reserves before peak season returns.
A financial model for a moving company needs to capture the job-based cost structure that makes this industry different from other service businesses. Your biggest variable cost is crew labor, which should typically run 30–40% of job revenue on local moves. Truck costs — fuel, maintenance, and lease or depreciation — add another 10–15%. Packing materials, cargo insurance claims, and marketing round out direct costs. The levers that move profitability are average job value, crew utilization (how many paying hours a crew works per day), and the attach rate on add-on services like packing and valuation coverage. A 5% improvement in average job value through better upselling of these add-ons can meaningfully shift your net margin.
Moving Company Industry at a Glance
Financial templates built for moving companies — from local movers to long-distance carriers. Pre-loaded with job-based billing, labor tracking, and the KPIs that matter for seasonal service businesses.
Revenue Drivers
- Local moves (hourly billing)
- Long-distance moves (flat-rate/weight-based)
- Packing services
- Storage and SIT fees
- Specialty item handling (pianos, safes)
- Valuation and liability coverage
Key Cost Categories
- Crew labor (field)
- Truck costs and fuel
- Insurance (cargo, liability, workers comp)
- Packing materials
- Marketing and lead generation
- Administrative labor
- Equipment maintenance
Typical Margins
Gross: 25-45% · Net: 7-10%
Seasonality
Peak season May–August accounts for ~60% of annual moves. June is the single busiest month. November–February is slowest; cash reserves built in summer cover winter operations.
Key Performance Indicators
Moving Company Financial Model FAQ
More Moving Company Templates
Moving Company Balance Sheet Template for Excel
$29
Moving Company Budget Template for Excel
$29
Moving Company Business Plan Template for Excel
$39
Moving Company Cash Flow Template for Excel
$29
Moving Company Expense Tracker Template for Excel
$29
Moving Company Income Statement Template for Excel
$29
Moving Company Invoice Template for Excel
$29
Moving Company KPI Dashboard Template for Excel
$29
Moving Company P&L Template for Excel
$29
Moving Company Pro Forma Template for Excel
$29
Moving Company Project Budget Template for Excel
$29
Moving Company Sales Forecast Template for Excel
$29
Moving Company Valuation Template for Excel
$29
More Financial Model Templates
Moving Company Financial Model Template
$29