Moving Company P&L Template
Track your moving company's revenue by job type, manage crew labor and fuel costs, and see your true net margin with a P&L built specifically for moving operators.
What's Inside This Moving Company P&L Template
This template includes 4 worksheets, each designed for a specific part of your moving company financial workflow:
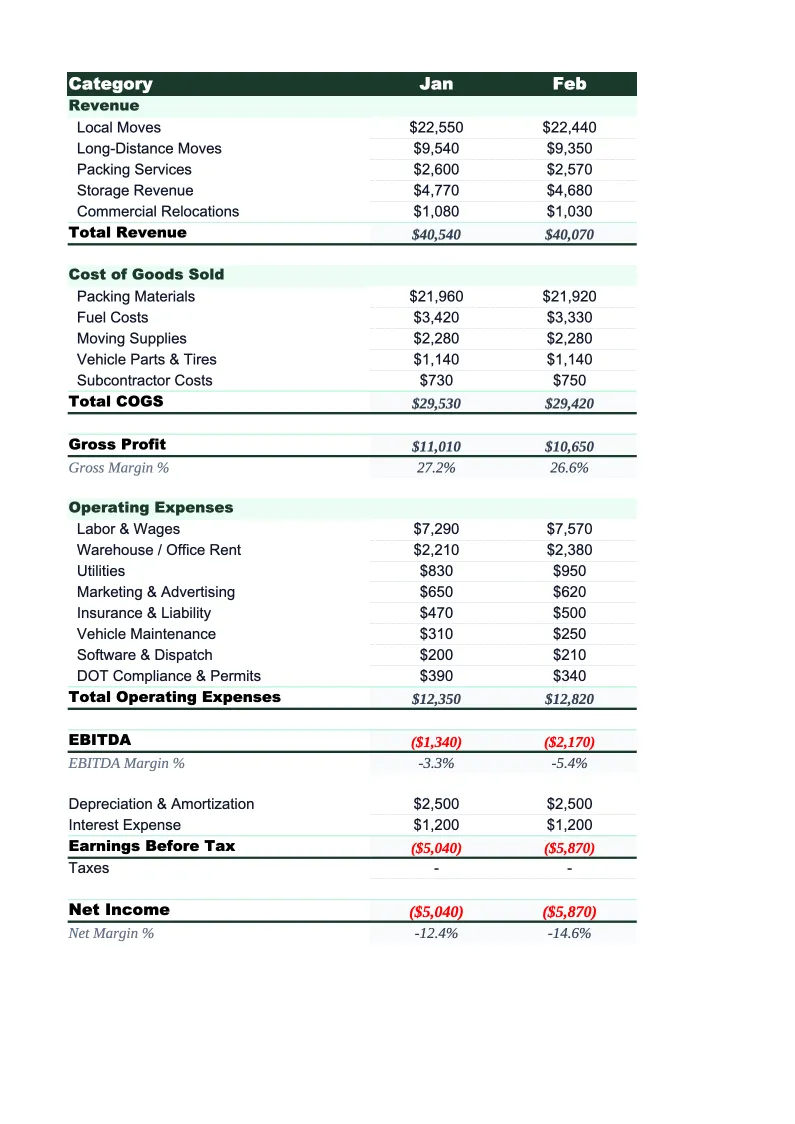
Monthly P&L
The core worksheet where you record each month's revenue and expenses.
Annual Summary
A 12-month view that pulls from each monthly sheet automatically.
Job Mix Analysis
A dedicated sheet for analyzing revenue and profitability by move type.
Dashboard
A visual summary with pre-built charts and KPI tiles covering the metrics that matter most to moving company operations.
Moving Company P&L Template Features
- Revenue split by local moves, long-distance, packing services, storage, and valuation coverage
- Crew labor tracked separately from truck, fuel, and insurance costs
- Job mix analysis with per-category revenue, job count, and average job value
- Monthly and annual P&L with gross margin and net income auto-calculations
- Crew labor percentage and cost-per-move KPI calculations
- Dashboard with charts for fuel cost %, labor %, and monthly net income
How to Use This Moving Company P&L Spreadsheet
Download the .xlsx file and open it in Excel or Google Sheets — no macros or plugins required. Start with the Monthly P&L sheet and review the pre-loaded revenue and expense categories. Most moving operators keep the structure as-is and adjust only a handful of line items to match their specific service mix — for example, an operator without storage would remove the SIT fee line, while one with a fleet of specialty vehicles might add a dedicated line for that equipment. Setup takes about 15 minutes.
Enter your current month's revenue by job type — local move billings, long-distance revenue, packing fees, storage income, and valuation coverage sold. Then enter expenses using your payroll records, fuel receipts, insurance invoices, and materials purchases. The Job Mix Analysis sheet is worth filling out at the same time: enter your job counts by type and the sheet calculates your average job value and crew labor ratio per category. Those two numbers tell you more about profitability than total revenue alone.
15 minutes from download to your first P&L
Download the template, plug in your numbers, and see your moving company's full financial picture — monthly P&L, job mix analysis, and annual summary included.
Why Every Moving Company Needs a P&L Template
Moving company finances are harder to manage than most service businesses because costs vary sharply by job type. A local hourly move and a long-distance flat-rate job can look similar in revenue but have completely different cost structures — the long-distance job carries higher fuel, per diem costs, and wear on trucks, while local moves carry more crew labor relative to revenue. Without splitting these out in a P&L, you can't tell whether your long-distance jobs are actually profitable or whether you're cross-subsidizing them with local volume. Industry net margins typically run 7–10%, meaning small cost overruns in one category can eliminate profit on an entire month.
The cost categories that move fastest in a moving company P&L are crew labor, fuel, and insurance. Crew labor typically runs 35–50% of revenue for local movers and 25–40% for companies doing significant long-distance volume. Fuel and truck operating costs usually represent 10–20% of revenue and are directly tied to miles driven — long-distance revenue per mile needs to be compared against fuel and driver costs per mile to evaluate route profitability. Insurance — cargo, liability, and workers comp — is a fixed overhead that typically runs 8–15% of revenue and should be tracked monthly against revenue to catch coverage gaps or premium increases before they compress margins further.
Moving Company Industry at a Glance
Financial templates built for moving companies — from local movers to long-distance carriers. Pre-loaded with job-based billing, labor tracking, and the KPIs that matter for seasonal service businesses.
Revenue Drivers
- Local moves (hourly billing)
- Long-distance moves (flat-rate/weight-based)
- Packing services
- Storage and SIT fees
- Specialty item handling (pianos, safes)
- Valuation and liability coverage
Key Cost Categories
- Crew labor (field)
- Truck costs and fuel
- Insurance (cargo, liability, workers comp)
- Packing materials
- Marketing and lead generation
- Administrative labor
- Equipment maintenance
Typical Margins
Gross: 25-45% · Net: 7-10%
Seasonality
Peak season May–August accounts for ~60% of annual moves. June is the single busiest month. November–February is slowest; cash reserves built in summer cover winter operations.
Key Performance Indicators
Moving Company P&L Template FAQ
More Moving Company Templates
Moving Company Balance Sheet Template for Excel
$29
Moving Company Budget Template for Excel
$29
Moving Company Business Plan Template for Excel
$39
Moving Company Cash Flow Template for Excel
$29
Moving Company Expense Tracker Template for Excel
$29
Moving Company Financial Model Template for Excel
$29
Moving Company Income Statement Template for Excel
$29
Moving Company Invoice Template for Excel
$29
Moving Company KPI Dashboard Template for Excel
$29
Moving Company Pro Forma Template for Excel
$29
Moving Company Project Budget Template for Excel
$29
Moving Company Sales Forecast Template for Excel
$29
Moving Company Valuation Template for Excel
$29
Moving Company P&L Template
$29