Event Planning KPI Dashboard Template
Track the metrics that drive a profitable event planning business — revenue per event, gross margin by event type, booking pipeline conversion, outstanding vendor payments, and client AR — in one dashboard built for planners and coordinators.
What's Inside This Event Planning KPI Dashboard Template
This template includes 6 worksheets, each designed for a specific part of your event planning financial workflow:
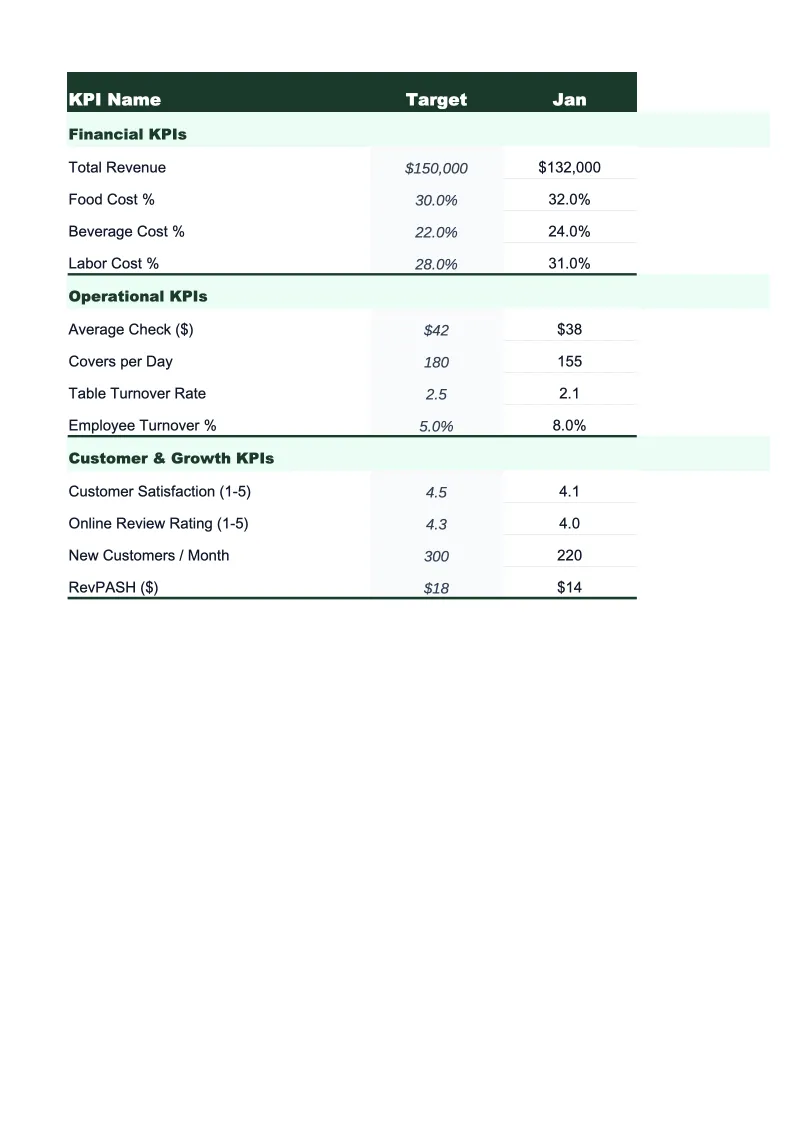
KPI Overview
The main dashboard that surfaces your event planning business's most critical performance indicators on one screen.
Events & Revenue
Tracks every active and completed event contract with the key financial details: client name, event date, event type, total contract value, billing structure (flat fee, cost-plus, or retainer), payment milestones, and amounts collected to date.
Booking Pipeline
Monitors your inquiry-to-contract conversion rate by lead source — referrals, corporate repeat clients, Google search, social media, and event industry directories.
Profitability per Event
Calculates true gross margin on each event by tracking contract revenue against direct costs — staff and coordinator wages, vendor pass-throughs (catering, AV, florals, transportation), venue deposits, equipment rentals, and any subcontractor fees.
Vendor & AP Tracker
Tracks all outstanding vendor invoices across active events — caterer deposits, AV rental balances, venue final payments, floral invoices, and photographer or videographer fees.
Monthly Trends
A 12-month rolling view of your five core KPIs displayed as line charts — average revenue per event, gross margin percentage, inquiry volume, booking conversion rate, and total AR outstanding — so you can see how performance has changed across the year.
Event Planning KPI Dashboard Template Features
- Revenue per event and gross margin by event type with direct cost tracking and effective hourly rate calculation
- Booking pipeline tracking by lead source — referrals, corporate repeat clients, Google, and social media
- Outstanding accounts receivable tracker with overdue milestone alerts and AR-to-contracted-revenue ratio
- Vendor and AP tracker with due date alerts and per-event cost reconciliation for cost-plus contracts
- Profitability per event with hours worked and effective rate to identify which event types actually make money
- 12-month trend charts showing seasonality in bookings, revenue, and margins across corporate and social segments
How to Use This Event Planning KPI Spreadsheet
Getting started takes about 20 minutes. Download the .xlsx file and open it in Excel or Google Sheets. Begin with the Events & Revenue sheet: enter each of your active contracts with the event date, event type, total contract value, and billing structure. Then open the Vendor & AP Tracker sheet and log your outstanding vendor invoices by event. Once those two sheets have data, the KPI Overview dashboard will automatically display your average contract value, gross margin position, and AR standing — giving you a functional baseline before you've done anything else. Most planners find the dashboard useful from the first day even with incomplete historical data, because the vendor payment view alone replaces a scattered spreadsheet or inbox search.
For ongoing use, update the dashboard in three rhythms. Update the Vendor & AP Tracker whenever you receive and pay vendor invoices — this is the most time-sensitive sheet and keeps your cash obligations visible at all times. Update the Booking Pipeline sheet whenever an inquiry comes in or a proposal is accepted, so your pipeline value and conversion rate stay current. Monthly, enter your profitability data for any events that completed during the period: total hours worked, direct costs incurred, and any add-on revenue collected. The Profitability per Event sheet is most accurate when updated within a week of each event while your recollection of the coordination effort is fresh.
20 minutes from download to your first business review
Download the template, enter your active contracts and vendor invoices, and see your event planning business's real margins, pipeline value, and AR position in one dashboard.
Why Every Event Planner Needs a KPI Dashboard
Event planning is a service business where revenue looks healthy until you account for what it actually costs to produce each event. The typical gross margins of 40–60% are achievable, but they require disciplined tracking of direct costs per event — particularly vendor pass-throughs, which in cost-plus contracts can represent 60–80% of total event spend. Many planners manage six-figure event budgets without a clear view of their own margin on each one, because client money and planner revenue flow through the same accounts. A KPI dashboard built for event planning separates those two things: what the client is spending versus what the planner is actually earning after vendor costs, staffing, and hours.
The KPIs that define profitable event planning businesses fall into three areas. Revenue quality — average contract value by event type, gross margin per event, and effective hourly rate — tells you whether your pricing reflects the actual work involved. Corporate events, galas, and conferences often have higher gross margins than weddings or social events because they're scoped more clearly and priced on deliverables rather than sentiment. Pipeline health — monthly inquiry volume, booking conversion rate by lead source, and percentage of revenue from repeat corporate clients — tells you how efficiently you're filling your calendar. Repeat corporate clients and warm referrals convert at dramatically higher rates and typically require far less proposal effort than cold directory inquiries. Financial stability — accounts receivable outstanding and vendor AP — tells you whether your cash position matches your calendar.
Event Planning Industry at a Glance
Financial templates built for event planners and event management businesses — from independent coordinators to full-service agencies handling weddings, corporate events, and conferences.
Revenue Drivers
- Planning and coordination fees
- Day-of coordination
- Vendor commissions or markups
- Design and decor services
- Event production fees
Key Cost Categories
- Venue rental
- Catering and bar service
- Staffing and labor
- Decor and florals
- AV and lighting equipment
- Photography and videography
- Transportation and logistics
Typical Margins
Gross: 40-60% · Net: 10-25%
Seasonality
Peak season in spring (April-June) and fall (September-November) for weddings; corporate events spike in Q1 and Q4.
Key Performance Indicators
Event Planning KPI Dashboard Template FAQ
More Event Planning Templates
Event Planning Balance Sheet Template for Excel
$29
Event Planning Budget Template for Excel
$29
Event Planning Business Plan Template for Excel
$39
Event Planning Cash Flow Template for Excel
$29
Event Planning Expense Tracker Template for Excel
$29
Event Planning Financial Model Template for Excel
$29
Event Planning Income Statement Template for Excel
$29
Event Planning Invoice Template for Excel
$29
Event Planning P&L Template for Excel
$29
Event Planning Pro Forma Template for Excel
$29
Event Planning Project Budget Template for Excel
$29
Event Planning Sales Forecast Template for Excel
$29
Event Planning Business Valuation Template for Excel
$29
More KPI Dashboard Templates
Event Planning KPI Dashboard Template
$29