Event Planning Sales Forecast Template
Project your event planning revenue by event type, pipeline stage, and revenue stream — with monthly breakdowns, lead conversion tracking, and actual vs forecast comparison built in.
What's Inside This Event Planning Sales Forecast Template
This template includes 6 worksheets, each designed for a specific part of your event planning financial workflow:
Assumptions
The control panel for your entire forecast.
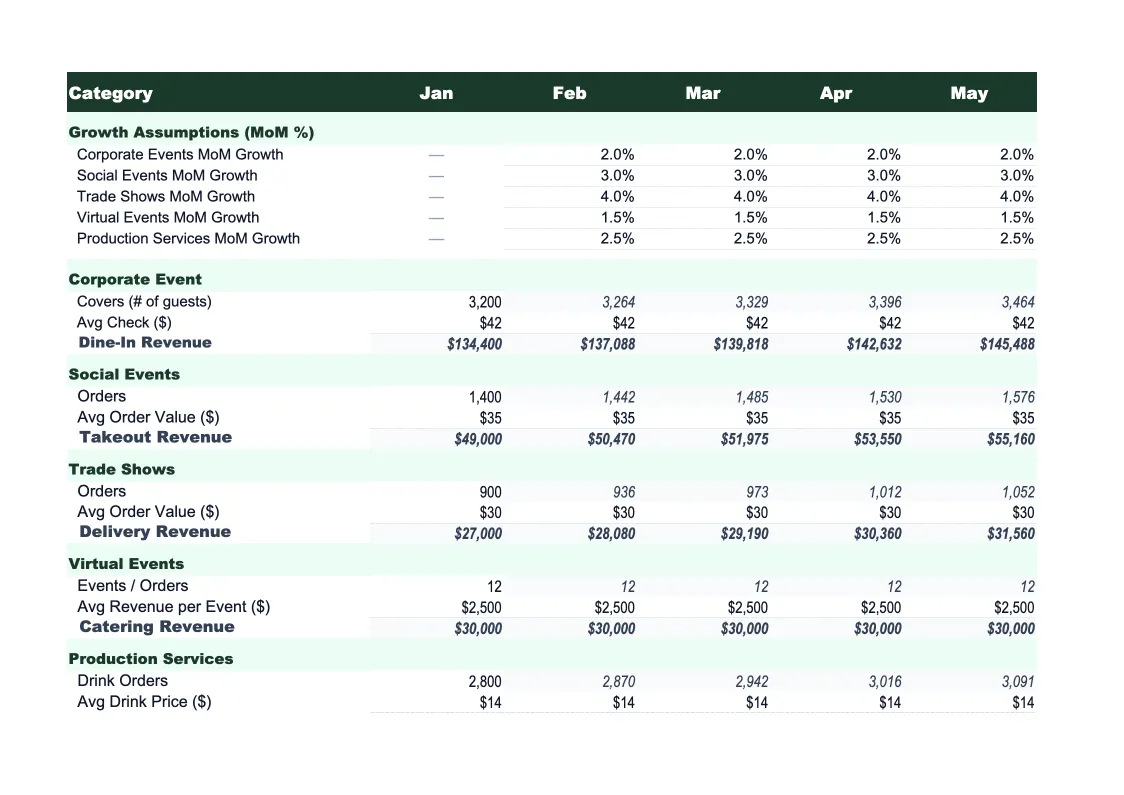
Monthly Forecast
The core projection sheet, showing 12 months of projected revenue broken out by event type and revenue stream.
Pipeline Tracker
A probability-weighted revenue pipeline that gives you a realistic picture of forward bookings.
Actual vs Forecast
Enter your actual monthly revenue by event type and revenue stream alongside your projections, and the sheet calculates dollar variance and percentage variance for every line.
Scenario Comparison
Three side-by-side annual forecasts — base case, upside, and downside — built from different assumption sets.
Dashboard
A visual summary of your forecast with pre-built charts: monthly revenue by event type (stacked bar), actual vs forecast trend line, revenue stream mix by month (stacked area), and pipeline weighted value by close month.
Event Planning Sales Forecast Template Features
- Driver-based model: events per month × average fee by event type
- Revenue split by stream — planning fees, vendor commissions, day-of coordination
- Probability-weighted pipeline tracker with stage-based close rates
- Seasonal adjustment factors for spring wedding season and Q4 corporate spikes
- Three-scenario comparison (base, upside, downside)
- Actual vs forecast tracker with rolling accuracy score
How to Use This Event Planning Sales Forecast Spreadsheet
Start with the Assumptions sheet, which drives every other calculation. Enter how many events you typically book per month by type — weddings, corporate events, social events — along with your average planning fee for each type. Then add your vendor commission or markup rate, day-of coordination fee, and expected close rates for each pipeline stage. If you have 12 months of historical bookings, use those averages as your baseline; if you're newer, start with conservative assumptions and adjust after the first quarter. Most event planners get through the initial setup in 20–30 minutes.
Once your assumptions are in, review the Monthly Forecast sheet to check whether the projections look realistic. Apply seasonal factors to the months where you know demand shifts — dial up April through June for wedding season, dial up October and November for fall events, and apply a lower factor to January and February. Then open the Pipeline Tracker and enter your current pipeline: every active inquiry, proposal, and contract with its estimated value and expected close date. The probability-weighted revenue totals will show you how your confirmed bookings and pipeline combine into a realistic near-term revenue picture.
15 minutes from download to your first revenue forecast
Download the template, plug in your event types and average fees, and see your event planning business's projected revenue — month by month, stream by stream.
Why Every Event Planning Business Needs a Sales Forecast
Event planning revenue is lumpy by nature — big deposits in one month, final payments in another, and dry spells in between. That pattern makes gut-feel revenue tracking particularly unreliable. Most event planners know their annual booked revenue but have a fuzzy picture of what will actually land in which month, which makes it hard to manage cash flow, decide when to hire, or know whether a slow quarter is a trend or just a timing issue. A driver-based forecast makes the assumptions explicit: how many events booked, at what average fee, by type, spread across months with seasonal adjustments.
The highest-leverage planning variable for event businesses isn't total revenue — it's pipeline by stage. Event planning has long sales cycles, especially for weddings and large corporate contracts. A couple might inquire in January for a September wedding, send a retainer in March, and pay the balance in August. If your forecast only counts booked revenue, you'll consistently underestimate what's coming and overreact to slow months. The Pipeline Tracker in this template applies stage-based probabilities so you can see weighted expected revenue alongside confirmed bookings — giving a much more accurate read on where you actually stand at any point in the year.
Event Planning Industry at a Glance
Financial templates built for event planners and event management businesses — from independent coordinators to full-service agencies handling weddings, corporate events, and conferences.
Revenue Drivers
- Planning and coordination fees
- Day-of coordination
- Vendor commissions or markups
- Design and decor services
- Event production fees
Key Cost Categories
- Venue rental
- Catering and bar service
- Staffing and labor
- Decor and florals
- AV and lighting equipment
- Photography and videography
- Transportation and logistics
Typical Margins
Gross: 40-60% · Net: 10-25%
Seasonality
Peak season in spring (April-June) and fall (September-November) for weddings; corporate events spike in Q1 and Q4.
Key Performance Indicators
Event Planning Sales Forecast Template FAQ
More Event Planning Templates
Event Planning Balance Sheet Template for Excel
$29
Event Planning Budget Template for Excel
$29
Event Planning Business Plan Template for Excel
$39
Event Planning Cash Flow Template for Excel
$29
Event Planning Expense Tracker Template for Excel
$29
Event Planning Financial Model Template for Excel
$29
Event Planning Income Statement Template for Excel
$29
Event Planning Invoice Template for Excel
$29
Event Planning KPI Dashboard Template for Excel
$29
Event Planning P&L Template for Excel
$29
Event Planning Pro Forma Template for Excel
$29
Event Planning Project Budget Template for Excel
$29
Event Planning Business Valuation Template for Excel
$29
More Sales Forecast Templates
Event Planning Sales Forecast Template
$29