Auto Repair KPI Dashboard Template
Track Average Repair Order, car count, effective labor rate, technician efficiency, and the other metrics that determine whether your auto repair shop is actually profitable.
What's Inside This Auto Repair KPI Dashboard Template
This template includes 5 worksheets, each designed for a specific part of your auto repair financial workflow:
KPI Dashboard
The main visual overview showing your shop's critical performance metrics at a glance.
Repair Order Tracker
A structured daily and weekly log for entering car count, repair order totals, parts revenue, and labor revenue by day.
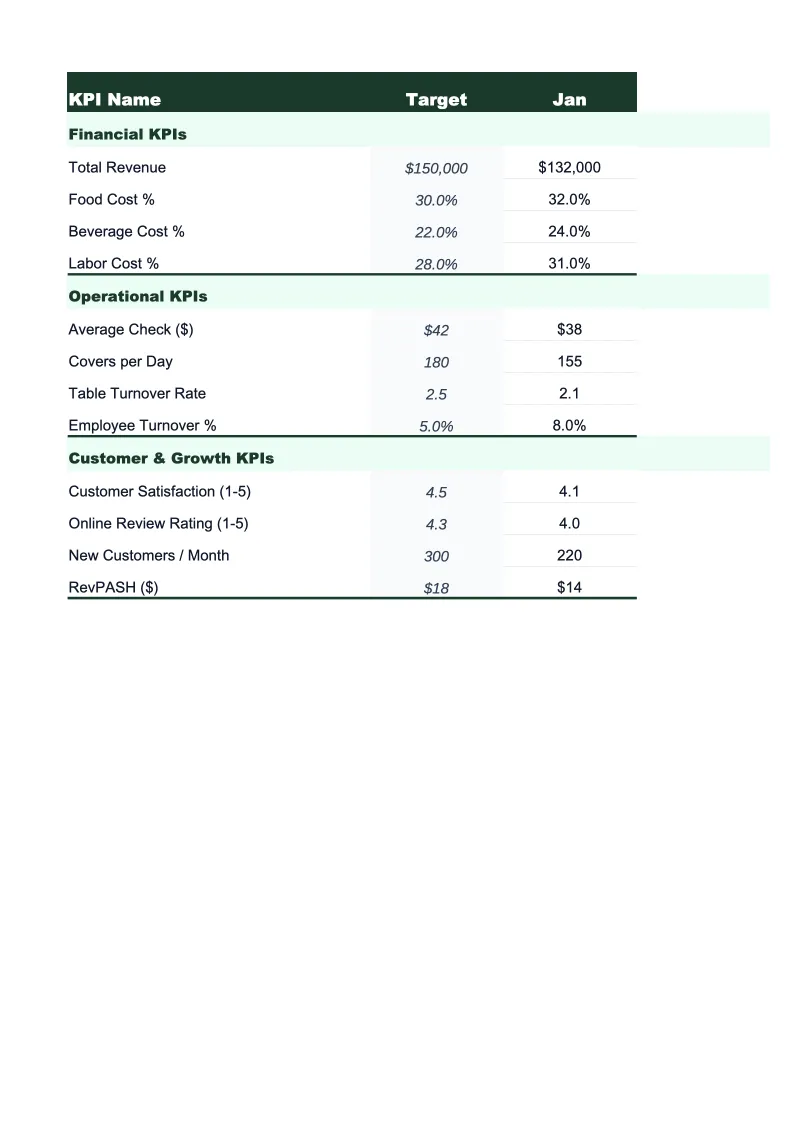
Monthly Scorecard
Set your targets for each KPI at the start of the month, then enter actuals as you go.
Technician Performance
A per-technician breakdown of billed hours, clocked hours, efficiency ratio, and revenue generated for each week and month.
12-Month Trends
A rolling 12-month view of your most important KPIs plotted as line charts.
Auto Repair KPI Dashboard Features
- 22 pre-loaded auto repair KPIs including ARO, effective labor rate, and parts-to-labor ratio
- Color-coded status indicators — green/yellow/red against your set monthly targets
- Daily repair order log with automatic ARO and parts margin calculations
- Per-technician efficiency and productivity tracker with weekly and monthly views
- 12-month trend charts for car count, ARO, and labor rate
- Separate parts and labor gross margin tracking with industry benchmark ranges
How to Use This Auto Repair KPI Spreadsheet
Start with the Monthly Scorecard tab and enter your targets for the month. If you don't have formal targets yet, use the benchmark ranges pre-loaded in the template — ARO targets, efficiency percentages, and gross margin ranges are drawn from industry data so you have a real baseline to compare against from day one. Setting targets takes about 15 minutes, and you only need to revisit them when your service mix or pricing changes significantly.
Log your repair orders in the Repair Order Tracker each day or at the end of each shift — it takes about three minutes once you have your management system open. Enter car count, total parts revenue, and total labor revenue for the day; the formulas calculate ARO, parts-to-labor ratio, and effective labor rate automatically. Update the Technician Performance sheet weekly with each tech's billed and clocked hours so the efficiency numbers stay current throughout the month.
15 minutes from download to your first KPI review
Download the template, enter your targets, and start tracking the metrics that actually determine whether your shop is running at full potential.
Why Every Auto Repair Shop Needs a KPI Dashboard
Auto repair shops run on tighter margins than most owners realize until they're deep into a slow month. With gross margins typically between 50–60% and net margins of 5–15%, the difference between a profitable month and a break-even one often comes down to a handful of variables: did car count hold up, did the average repair order stay above target, and did techs bill enough hours relative to the hours they were on the clock? Without a dashboard, most shop owners find out the answer to those questions when their accountant sends a P&L — by which point it's too late to do anything about it.
The KPIs that matter most in auto repair fall into three groups. Revenue drivers: car count tells you whether traffic is holding; ARO tells you whether you're capturing the full scope of work on each vehicle; and effective labor rate tells you whether you're actually getting close to your door rate or leaving money on the table through discounting and comebacks. Efficiency metrics: technician efficiency (billed hours divided by clocked hours) and productivity (billed hours divided by flagged or available time) measure whether your labor is being used well. And profitability metrics: parts gross margin, labor gross margin, and gross profit per available labor hour tell you whether the work you're doing is producing the returns it should. Parts should typically carry 40–50% gross margin; labor should carry 65–75%.
Auto Repair Industry at a Glance
Financial templates built for auto repair shops — from single-bay independents to multi-location service centers. Pre-loaded with labor, parts, and overhead categories specific to the automotive service industry.
Revenue Drivers
- Labor (repair services)
- Parts sales
- Oil changes & maintenance
- Diagnostics & inspections
- Tire sales
- Shop supplies fees
Key Cost Categories
- Parts & materials (COGS)
- Technician labor
- Rent & occupancy
- Equipment & tools
- Utilities
- Insurance
- Marketing & advertising
- Shop supplies
Typical Margins
Gross: 50-60% · Net: 5-15%
Seasonality
Busiest in summer (June–August) and spring (March–May) for maintenance and travel prep; January–February are consistently the slowest months.
Key Performance Indicators
Auto Repair KPI Dashboard FAQ
More Auto Repair Templates
Auto Repair Shop Balance Sheet Template for Excel
$29
Auto Repair Shop Budget Template for Excel
$29
Auto Repair Shop Business Plan Template for Excel
$39
Auto Repair Shop Cash Flow Template for Excel
$29
Auto Repair Expense Tracker Template for Excel
$29
Auto Repair Financial Model Template for Excel
$29
Auto Repair Income Statement Template for Excel
$29
Auto Repair Invoice Template for Excel
$29
Auto Repair P&L Template for Excel
$29
Auto Repair Shop Pro Forma Template for Excel
$29
Auto Repair Shop Project Budget Template for Excel
$29
Auto Repair Sales Forecast Template for Excel
$29
Auto Repair Shop Valuation Template for Excel
$29
More KPI Dashboard Templates
Auto Repair KPI Dashboard Template
$29