Event Planning Financial Model Template
Project revenue across corporate, social, and charity events, model the cash flow gap between deposits and billing milestones, and forecast full-year profitability with industry benchmarks built in.
What's Inside This Event Planning Financial Model Template
This template includes 8 worksheets, each designed for a specific part of your event planning financial workflow:
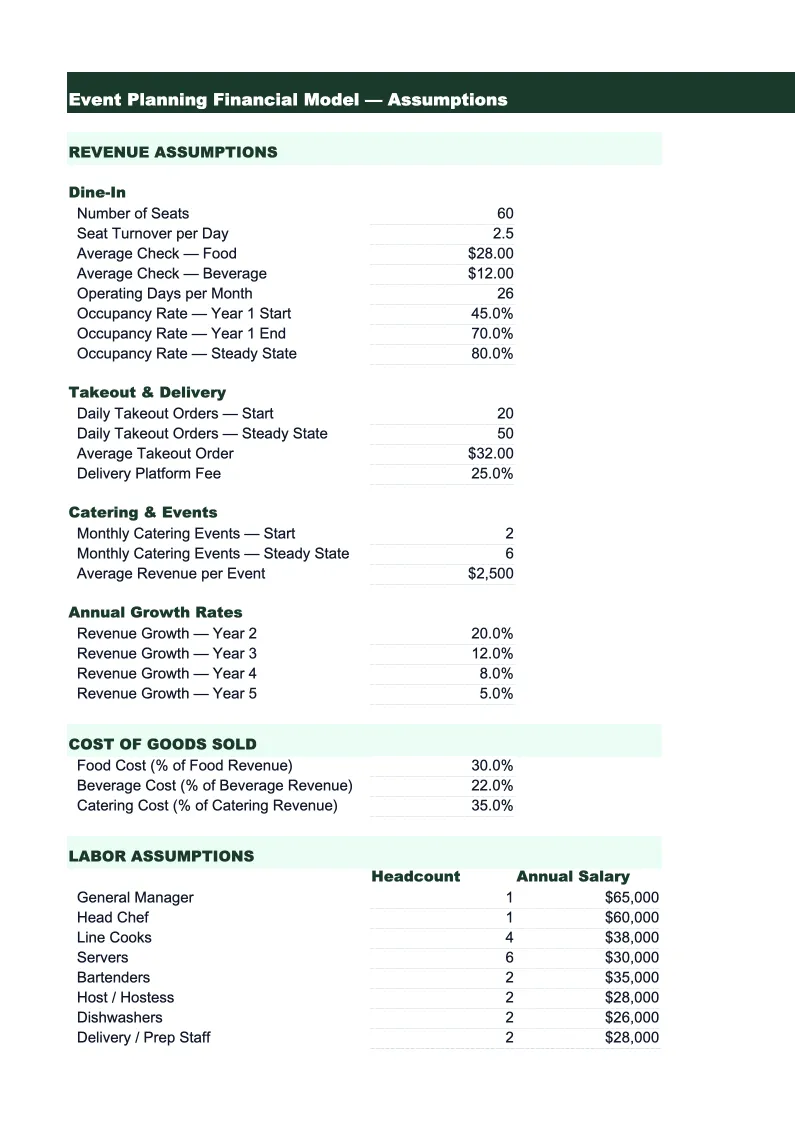
Assumptions
The central inputs sheet that drives every projection in the model.
Event Pipeline
A 12-month tracking sheet that maps your booked events to the months when deposits, milestone payments, and final balances actually arrive in your bank account.
Revenue Projections
A detailed month-by-month revenue forecast organized by event type — corporate meetings and conferences, social galas and fundraisers, nonprofit charity events, trade shows and expos, and private social events.
Expense Budget
A comprehensive expense plan organized around the actual cost structure of an event planning business.
P&L Summary
A monthly income statement that consolidates all revenue and expense lines into a clear picture of profitability.
Cash Flow
A month-by-month cash flow projection that separates cash receipts from earned revenue — a critical distinction for event planners managing large events with multi-month lead times.
Capacity & Growth
A planning tool for understanding your maximum event capacity and what growth means for the business.
Dashboard
A one-page summary of the model's key outputs, formatted for quick review or sharing with a business partner, accountant, or lender.
Event Planning Financial Model Template Features
- Multi-payment billing model — tracks deposits, milestone payments, and final balances by event
- Event-type revenue forecast: corporate, social, nonprofit, trade shows, and private events
- Seasonal weighting for Q1/Q4 corporate spikes and spring/fall social event peaks
- Gross margin and net margin benchmarks flagged directly on the P&L sheet
- Capacity planning tool to model coordinator hires and revenue ceiling by event type
- 3-year growth scenario with conservative, base, and aggressive trajectories
How to Use This Event Planning Financial Spreadsheet
Start with the Assumptions sheet and work through it top to bottom. Enter your service types and their pricing, your approximate event volume per month broken out by event type, and your billing model — whether you charge a flat management fee, a percentage of total event budget, or a cost-plus markup on vendor invoices. If you're not sure where to set prices, the industry benchmarks built into the sheet give you a starting range: full-service corporate event management typically runs $5,000–$20,000+ depending on event scale, while day-of coordination fees range from $1,500–$3,500. Use your best estimates on day one — the model gets more useful as you replace estimates with actuals over time.
The Event Pipeline sheet is where cash flow planning happens. For each confirmed event, enter the billing structure (deposit percentage, milestone payments, final balance timing) and the event date. The sheet maps each payment to the month it arrives in your account, which is often very different from when the event happens. A corporate conference happening in March might have a deposit arriving in November and a final balance in February — and your cash flow in March itself may be thin. Review this sheet before taking on new events, especially large ones that require you to pay venue deposits or catering advances before client payments arrive. Understanding the float is how event planners avoid cash crunches during their busiest seasons.
30 minutes from download to your first full-year projection
Download the template, enter your event types and billing assumptions, and see your event planning business's full financial picture — cash flow timing, seasonal peaks, and growth scenarios included.
Why Every Event Planning Business Needs a Financial Model
Event planning businesses carry a cash flow risk that most service businesses don't: you often pay vendors before clients pay you. A corporate client books a 200-person conference, you pay the venue deposit and catering advance weeks before the event, and the client's final payment arrives 30 days after the invoice — which is 30 days after the event. If you have three large events in the same quarter, the vendor advances alone can represent $30,000–$80,000 in cash that's out of your account before a dollar of final revenue arrives. This is why event planners with strong bookings still run into cash problems, and why a financial model that tracks payment timing is more valuable than a simple P&L.
The two metrics that define a sustainable event planning business are revenue per event and gross margin per event type. Revenue per event depends heavily on the size and complexity of events you take on — a small corporate team dinner at $3,000 and a 500-person gala at $25,000 are both 'events,' but they have completely different resource requirements and margin profiles. Gross margin per event — what's left after direct costs — should run 40–60% for well-priced full-service management. If you use a cost-plus model and mark up vendor invoices by 15–20%, that markup revenue dramatically improves margins on large events but creates more administrative overhead tracking client-facing budgets. Knowing which event types are most profitable is the insight that lets you prioritize your sales pipeline.
Event Planning Industry at a Glance
Financial templates built for event planners and event management businesses — from independent coordinators to full-service agencies handling weddings, corporate events, and conferences.
Revenue Drivers
- Planning and coordination fees
- Day-of coordination
- Vendor commissions or markups
- Design and decor services
- Event production fees
Key Cost Categories
- Venue rental
- Catering and bar service
- Staffing and labor
- Decor and florals
- AV and lighting equipment
- Photography and videography
- Transportation and logistics
Typical Margins
Gross: 40-60% · Net: 10-25%
Seasonality
Peak season in spring (April-June) and fall (September-November) for weddings; corporate events spike in Q1 and Q4.
Key Performance Indicators
Event Planning Financial Model Template FAQ
More Event Planning Templates
Event Planning Balance Sheet Template for Excel
$29
Event Planning Budget Template for Excel
$29
Event Planning Business Plan Template for Excel
$39
Event Planning Cash Flow Template for Excel
$29
Event Planning Expense Tracker Template for Excel
$29
Event Planning Income Statement Template for Excel
$29
Event Planning Invoice Template for Excel
$29
Event Planning KPI Dashboard Template for Excel
$29
Event Planning P&L Template for Excel
$29
Event Planning Pro Forma Template for Excel
$29
Event Planning Project Budget Template for Excel
$29
Event Planning Sales Forecast Template for Excel
$29
Event Planning Business Valuation Template for Excel
$29
More Financial Model Templates
Event Planning Financial Model Template
$29