Cleaning Service KPI Dashboard Template
Track revenue per cleaner per day, client retention rate, labor cost percentage, and the other metrics that show whether your cleaning business is running efficiently or leaking margin on every job.
What's Inside This Cleaning Service KPI Dashboard Template
This template includes 5 worksheets, each designed for a specific part of your cleaning service financial workflow:
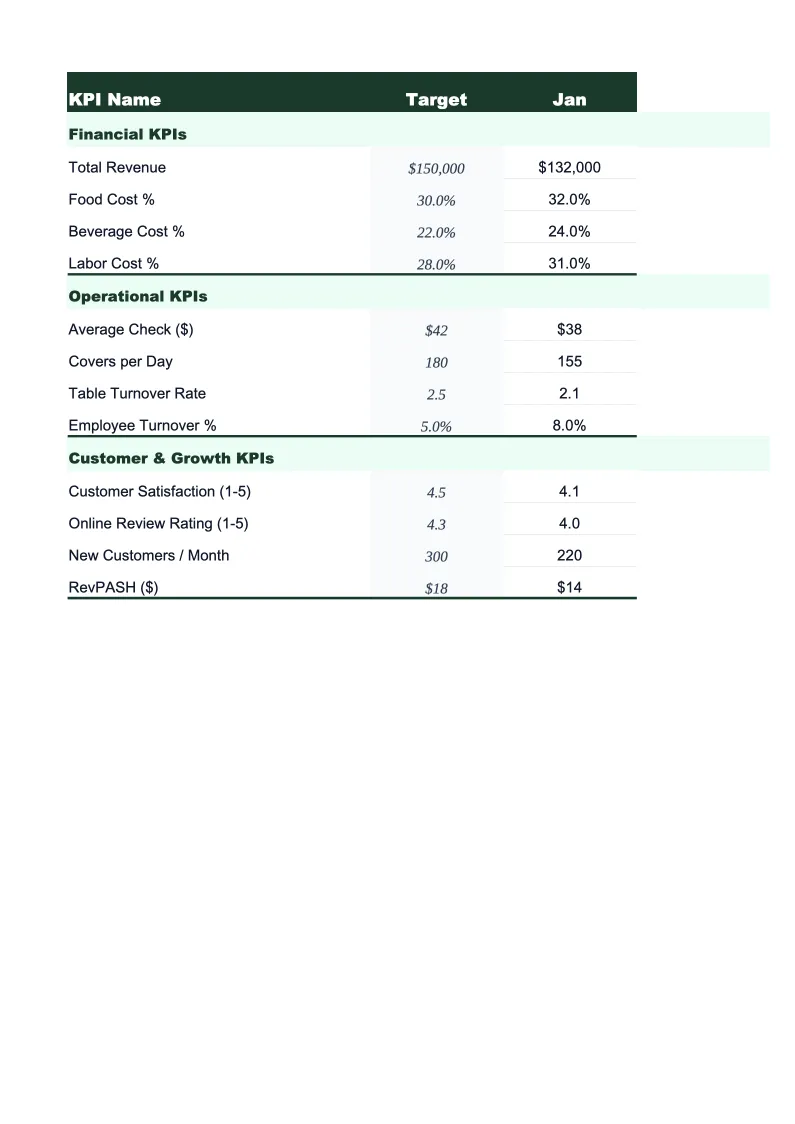
KPI Dashboard
The main visual overview that pulls your most critical metrics into one screen.
Job Log
A structured record for every cleaning job completed — recurring residential visits, commercial contracts, one-time deep cleans, move-in/move-out jobs, and post-construction cleanups.
Monthly Scorecard
Set your monthly targets at the start of the period, then enter actuals as the month progresses.
Client Retention Tracker
A month-by-month record of your recurring client base — the core of any cleaning business.
12-Month Trends
A rolling 12-month view of your key KPIs plotted as line charts.
Cleaning Service KPI Dashboard Features
- 20 pre-loaded cleaning KPIs including revenue per cleaner per day and re-clean rate
- Job log with per-job tracking for labor hours, supply costs, billings, and gross margin
- Client retention tracker — active clients, new clients, cancellations, and retention rate per month
- Monthly scorecard with target vs. actual tracking and color-coded status indicators
- Cancellation reason tracking to identify why clients leave and spot quality or pricing patterns
- 12-month trend charts for revenue per cleaner, retention rate, and labor cost percentage
How to Use This Cleaning Business KPI Spreadsheet
Start with the Monthly Scorecard and set your targets before the month begins. If you're not sure what's realistic, the template includes benchmark ranges based on typical cleaning company performance: revenue per cleaner per day between $200–$350, labor cost target at 35–45% of revenue, and a client retention rate target above 85% monthly. Review the pre-loaded KPIs and adjust any target that doesn't fit your market — a high-end residential service in a major metro will have different benchmarks than a volume-based maid service in a smaller market. Setting targets takes about 15 minutes and only needs updating when your pricing, staffing, or service mix changes.
Log each job in the Job Log as it's completed or invoiced. Enter the client name, job type, team size, hours worked, supply cost used, and the amount billed. The formulas calculate revenue per cleaner-hour and gross margin automatically — you don't need to do any manual math. For high-volume residential routes, you can log the full day's route as a single entry by crew, or break it down by property if you want job-level margin detail. The monthly totals from the Job Log feed the Scorecard and Dashboard automatically, so your KPI view builds itself over the course of the month.
15 minutes from download to your first KPI review
Download the template, set your targets, and start tracking the metrics that determine whether your cleaning business is profitable job by job.
Why Every Cleaning Business Needs a KPI Dashboard
Cleaning businesses typically run on thin net margins — 10–20% for well-run operations — which means small inefficiencies in labor deployment or client retention have a disproportionate impact on the bottom line. The most common problem isn't that owners aren't working hard; it's that they're managing by revenue and expense totals without tracking the operational ratios that actually drive profitability. Revenue per cleaner per day is the single most important metric for a cleaning business: it tells you whether your scheduling is efficient, whether your pricing is right for each job type, and whether certain accounts are chronically over in hours. Without a structured dashboard, most cleaning companies only discover a client or service type is unprofitable at year-end, after the margin has already been lost.
Three metrics matter more than anything else in cleaning. First, labor cost percentage — labor is typically 35–45% of revenue in a well-run operation, and when it creeps above 50% the business is essentially running break-even or at a loss on many jobs. The culprit is usually jobs that run over in hours due to underestimating at onboarding, scope creep from clients who add tasks, or scheduling gaps that turn into unpaid drive time. Second, client retention rate — recurring clients are the entire foundation of a cleaning business's economics. Replacing a cancelled client costs roughly 3–5 times what it costs to keep one, because of marketing spend, onboarding time, and the fact that new clients take several visits to clean efficiently. A retention rate below 80% means the business is running fast just to stay in place. Third, re-clean rate — the percentage of jobs that require a return visit due to quality issues. Each re-clean is a 100% labor cost with zero billing, and a re-clean rate above 3% signals a quality or training problem that will eventually drive client cancellations.
Cleaning Service Industry at a Glance
Financial templates built for residential and commercial cleaning businesses — pre-loaded with labor, supplies, and overhead categories, and structured around the recurring contract model most cleaning companies run on.
Revenue Drivers
- Recurring residential contracts
- Commercial cleaning contracts
- One-time deep cleans
- Move-in/move-out cleaning
- Post-construction cleanup
Key Cost Categories
- Labor (wages & payroll taxes)
- Cleaning supplies & chemicals
- Equipment & tools
- Vehicle & transportation
- Liability insurance
- Marketing & advertising
Typical Margins
Gross: 40-55% · Net: 10-20%
Seasonality
Spring (March-April) peaks with spring cleaning demand; back-to-school surge in August-September; summer slightly slower as clients vacation; commercial cleaning demand is relatively steady year-round.
Key Performance Indicators
Cleaning Service KPI Dashboard FAQ
More Cleaning Service Templates
Cleaning Service Balance Sheet Template for Excel
$29
Cleaning Service Budget Template for Excel
$29
Cleaning Service Business Plan Template for Excel
$39
Cleaning Service Cash Flow Template for Excel
$29
Cleaning Service Expense Tracker Template for Excel
$29
Cleaning Service Financial Model Template for Excel
$29
Cleaning Service Income Statement Template for Excel
$29
Cleaning Service Invoice Template for Excel
$29
Cleaning Service P&L Template for Excel
$29
Cleaning Service Pro Forma Template for Excel
$29
Cleaning Service Project Budget Template for Excel
$29
Cleaning Service Sales Forecast Template for Excel
$29
Cleaning Service Business Valuation Template for Excel
$29
More KPI Dashboard Templates
Cleaning Service KPI Dashboard Template
$29