Accounting Firm KPI Dashboard Template
Track utilization rate, realization rate, collection rate, DSO, and the other metrics that tell you whether your accounting practice is running at full potential — or quietly leaving money on the table.
What's Inside This Accounting Firm KPI Dashboard Template
This template includes 5 worksheets, each designed for a specific part of your accounting firm financial workflow:
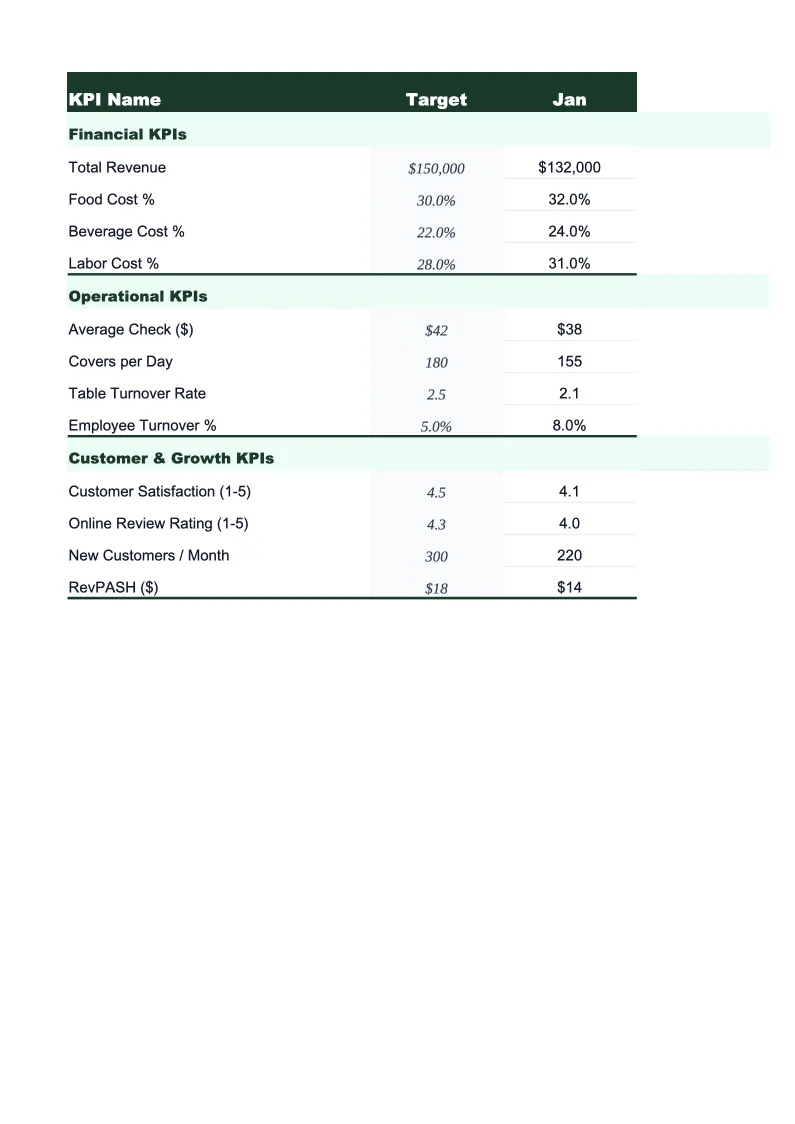
KPI Dashboard
The main visual overview displaying your practice's critical performance metrics at a glance.
Staff Timesheet
A structured weekly log for entering billable and non-billable hours by staff member and by service line — tax, audit and assurance, client accounting services (CAS), advisory and fractional CFO, and payroll.
Monthly Scorecard
Set your KPI targets at the start of each month — adjustable for busy season versus off-season — then enter actuals as you close the month.
Client Profitability
A client-by-client and service-line profitability tracker that shows fees billed versus hours worked for each active account.
12-Month Trends
A rolling 12-month view of your most important KPIs plotted as line charts.
Accounting Firm KPI Dashboard Features
- 22 pre-loaded accounting firm KPIs including utilization rate, realization rate, and DSO
- Color-coded status indicators — green/yellow/red against your monthly and busy-season targets
- Weekly staff timesheet with billable vs. non-billable tracking by service line (tax, audit, CAS, advisory)
- Client profitability tracker comparing budgeted vs. actual hours and fees per account
- Busy season capacity planning with adjustable targets for Jan–Apr and Sept–Oct crunch periods
- 12-month trend charts for utilization rate, realization rate, collection rate, and revenue per FTE
How to Use This Accounting Firm KPI Spreadsheet
Start with the Monthly Scorecard tab and enter your targets for the current period. If you don't have formal targets yet, use the benchmark ranges pre-loaded in the template — utilization rate thresholds, realization benchmarks, and collection rate targets are drawn from public accounting industry data so you have a real baseline from day one. Set separate targets for busy season months (January through April and September through October) versus off-season months — utilization expectations and billing rates often differ between the two. Initial setup takes about 20 minutes.
Log staff hours in the Timesheet tab weekly, separating time by service line: tax, audit, CAS, advisory, and payroll. The formulas calculate utilization rate per staff member and flag anyone tracking below their monthly target with enough time to shift workload or adjust scheduling. Update the Client Profitability sheet quarterly for fixed-fee and retainer clients — this is where you'll catch tax clients whose returns consistently run over budget, or CAS accounts where the monthly retainer no longer covers actual hours worked. Catching margin compression at the client level is easier than diagnosing it in aggregate.
15 minutes from download to your first KPI review
Download the template, enter your targets, and start tracking the metrics that determine whether your practice is running at full potential.
Why Every Accounting Practice Needs a KPI Dashboard
Accounting firms lose money in the same way most professional service firms do: not through dramatic failures, but through gradual leakage that's invisible until it's entrenched. A firm billing at $200 per hour, with 10 staff at 70% utilization, should produce $2.8M in annual revenue — but if realization rate is 82% (write-downs and write-offs reduce collected fees), and collection rate is 93%, actual collected revenue is closer to $2.1M. That $700,000 gap isn't a client problem or a staffing problem — it's a measurement problem. A KPI dashboard that tracks utilization, realization, and collection together makes that gap visible, attributable, and manageable.
The KPIs that matter most in accounting practice management fall into three categories. Productivity metrics: utilization rate (billable hours as a percentage of total available hours, target 65–75% outside busy season), billable hours per FTE, and revenue per FTE measure whether the practice's capacity is being used effectively. Profitability metrics: realization rate by service line, write-off rate, and client profitability reveal whether pricing is right and whether certain engagements are consuming more time than they generate in fees — a chronic problem with fixed-fee tax clients and underpriced CAS retainers. Collection metrics: collection rate, DSO, and AR aging by bucket tell you whether cash flow is healthy or whether working capital is being tied up in slow-paying clients. Practices should target 90%+ realization and 95%+ collection rate; underperforming firms typically have structural problems in one of these two areas.
Accounting Firm Industry at a Glance
Financial templates built for accounting firms and CPA practices — from solo practitioners to multi-partner firms. Pre-loaded with billable hour tracking, realization rate calculations, and service categories that reflect how accounting firms actually bill.
Revenue Drivers
- Tax preparation and planning
- Audit and assurance
- Bookkeeping and client accounting services (CAS)
- Advisory and fractional CFO services
- Payroll processing
Key Cost Categories
- Professional staff salaries and benefits
- Administrative staff
- Occupancy and rent
- Technology and software (tax, practice management)
- Malpractice (E&O) insurance
- Marketing and business development
- CPE and professional development
- Subcontractors and offshore staff
Typical Margins
Gross: 50-65% · Net: 20-35%
Seasonality
Heavy busy season January through April 15; secondary crunch in September through October 15 for extensions. Slowest months are July and August.
Key Performance Indicators
Accounting Firm KPI Dashboard FAQ
More Accounting Firm Templates
Accounting Firm Balance Sheet Template for Excel
$29
Accounting Firm Budget Template for Excel
$29
Accounting Firm Business Plan Template for Excel
$39
Accounting Firm Cash Flow Template for Excel
$29
Accounting Firm Expense Tracker Template for Excel
$29
Accounting Firm Financial Model Template for Excel
$29
Accounting Firm Income Statement Template for Excel
$29
Accounting Firm Invoice Template for Excel
$29
Accounting Firm P&L Template for Excel
$29
Accounting Firm Pro Forma Template for Excel
$29
Accounting Firm Project Budget Template for Excel
$29
Accounting Firm Sales Forecast Template for Excel
$29
Accounting Firm Valuation Template for Excel
$29
More KPI Dashboard Templates
Accounting Firm KPI Dashboard Template
$29