Church KPI Dashboard Template
Track your church's key performance indicators — giving per attender, personnel cost ratios, facility utilization, operating reserves, and ministry program health — in one dashboard built for religious organizations.
What's Inside This Church KPI Dashboard Template
This template includes 6 worksheets, each designed for a specific part of your church financial workflow:
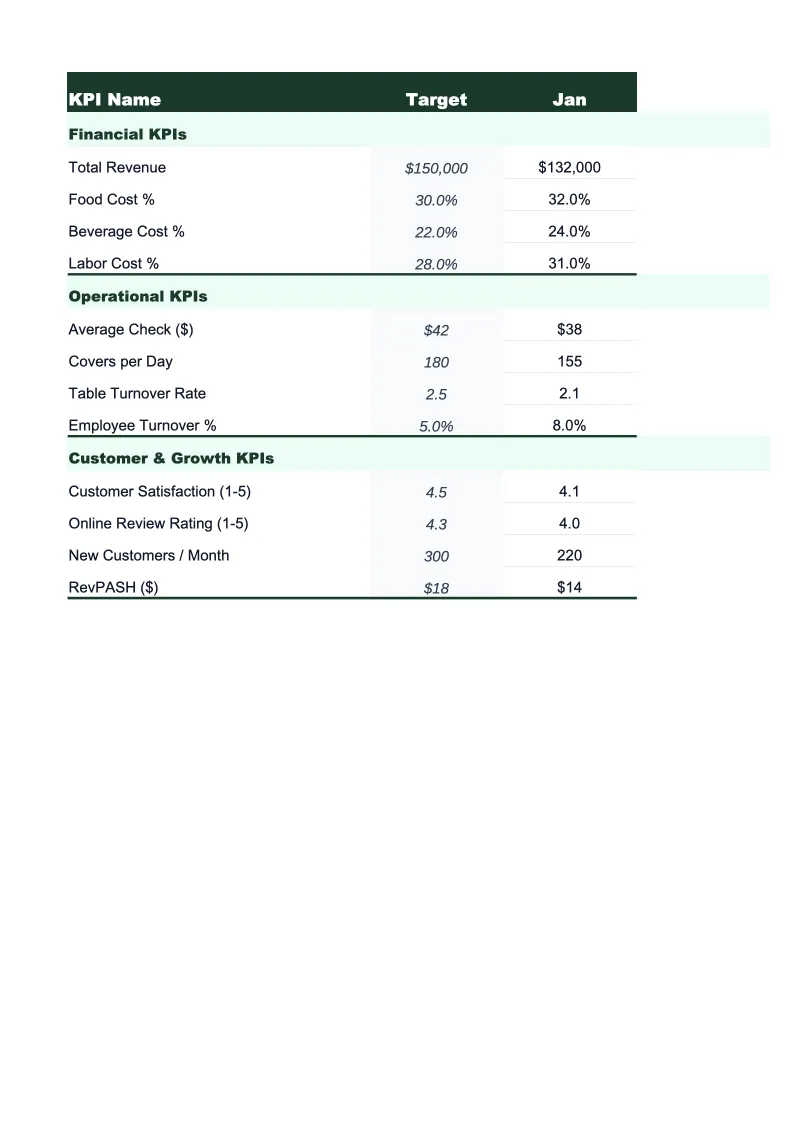
KPI Overview
The main dashboard that surfaces your church's most important performance indicators on a single screen.
Giving & Revenue
Tracks weekly and monthly giving trends, giving per regular attender, and revenue breakdown by source — tithes and regular offerings, special offerings (Christmas, Easter, building fund), facility rental income, school or childcare tuition, and memorial or cemetery fees.
Expense Ratios
Monitors how your total budget is allocated across the four major expense categories that church governance experts track most closely: personnel and housing allowance, facilities and occupancy, ministry programs, and missions and benevolence.
Facility Utilization
Tracks how effectively your church property is being used across the week.
Financial Reserves
Calculates operating reserve months using the standard formula: unrestricted cash and liquid assets divided by average monthly operating expenses.
Monthly Trends
A 12-month rolling view of your five core KPIs — giving per attender, personnel cost ratio, facility utilization, operating reserve months, and total giving — displayed as line charts so leadership can see how performance has moved across the year.
Church KPI Dashboard Template Features
- Giving per attender calculation with weekly attendance input and year-over-year comparison
- Personnel, facilities, programs, and missions expense ratios with benchmark targets
- Facility utilization rate by space — sanctuary, fellowship hall, classrooms
- Operating reserve months calculation with debt service coverage ratio
- Seasonal giving trend charts showing Christmas, Easter, and summer patterns
- Budget vs. actual variance tracking across all four major expense categories
How to Use This Church KPI Spreadsheet
Getting started takes about 20 minutes. Download the .xlsx file and open it in Excel or Google Sheets. Begin with the Giving & Revenue sheet: enter your average weekly attendance and giving totals for the past three months to establish a baseline. Then move to the Expense Ratios sheet and enter your actual spending in personnel, facilities, programs, and missions for the current period. The KPI Overview dashboard populates from those inputs, showing your key ratios and reserve position before you've finished the initial setup.
For ongoing use, update the sheets monthly — typically after your monthly bookkeeping close. The Giving & Revenue sheet is most useful when updated after each Sunday giving total is reconciled, but monthly summaries work well for most churches. The Facility Utilization sheet takes five minutes per month: log the actual hours each space was used during the period. If you track giving in Planning Center Giving or Breeze, you can copy monthly totals directly into the spreadsheet rather than entering line by line.
20 minutes from download to your first board dashboard
Download the template, enter your current giving and expense figures, and walk into your next elder board meeting with a clear picture of giving health, cost ratios, and operating reserves.
Why Every Church Needs a KPI Dashboard
Churches operate under financial expectations that differ from most other organizations. Congregation members contribute not as customers paying for a service but as participants in a shared mission, which means financial transparency and stewardship reporting carry significant relational weight. When giving drops, the first instinct is often to preach on generosity — but without a KPI dashboard, it's easy to miss that the actual problem is a 10% summer attendance decline, a one-time special offering distorting the prior-year comparison, or a facilities cost that has grown to 34% of budget and is crowding out ministry spending.
The metrics that healthy churches track consistently are well-known among church finance practitioners. Giving per attender — total giving divided by average weekend attendance — is the most important leading indicator of financial health, typically ranging from $25 to $75 per attender per week depending on congregation demographics and generosity culture. Personnel costs at 45–55% of total expenses is the widely cited benchmark; churches above 60% often face the choice between staff cuts and reduced ministry programming. Facilities costs above 30% typically signal either an aging building with deferred maintenance or a congregation that has outgrown its giving capacity relative to its building size. Operating reserves of three to six months protect against the inevitable summer giving dip and any unexpected capital expenses.
Church Industry at a Glance
Financial templates built for churches and religious organizations — facility rentals, ceremony fees, staff payroll, and ministry budgets.
Revenue Drivers
- Tithes and weekly offerings
- Facility rental income
- Special offerings (Christmas, Easter)
- School and childcare tuition
- Cemetery and memorial service fees
Key Cost Categories
- Personnel and housing allowance
- Facilities and occupancy
- Worship and ministry programs
- Missions and benevolence
- Administration and software
- Debt service
Typical Margins
Gross: N/A · Net: 0-5% operating surplus
Seasonality
Giving peaks at Christmas and Easter; summer typically sees 10-20% attendance and giving decline. Year-end giving surge in December is common for tax purposes.
Key Performance Indicators
Church KPI Dashboard Template FAQ
More Church Templates
Church Balance Sheet Template for Excel
$29
Church Budget Template for Excel
$29
Church Budget & Financial Plan Template for Excel
$39
Church Cash Flow Template for Excel
$29
Church Expense Tracker Template for Excel
$29
Church Financial Model Template for Excel
$29
Church Income Statement Template for Excel
$29
Church Invoice Template for Excel
$29
Church P&L Template for Excel
$29
Church Pro Forma Template for Excel
$29
Church Project Budget Template for Excel
$29
Church Revenue Forecast Template for Excel
$29
Church Valuation Template for Excel
$29
More KPI Dashboard Templates
Church KPI Dashboard Template
$29