SaaS Financial Model Template
Project MRR growth, model your unit economics, and run a full 3-statement forecast — built specifically for subscription software businesses.
What's Inside This SaaS Financial Model Template
This template includes 7 worksheets, each designed for a specific part of your saas financial workflow:
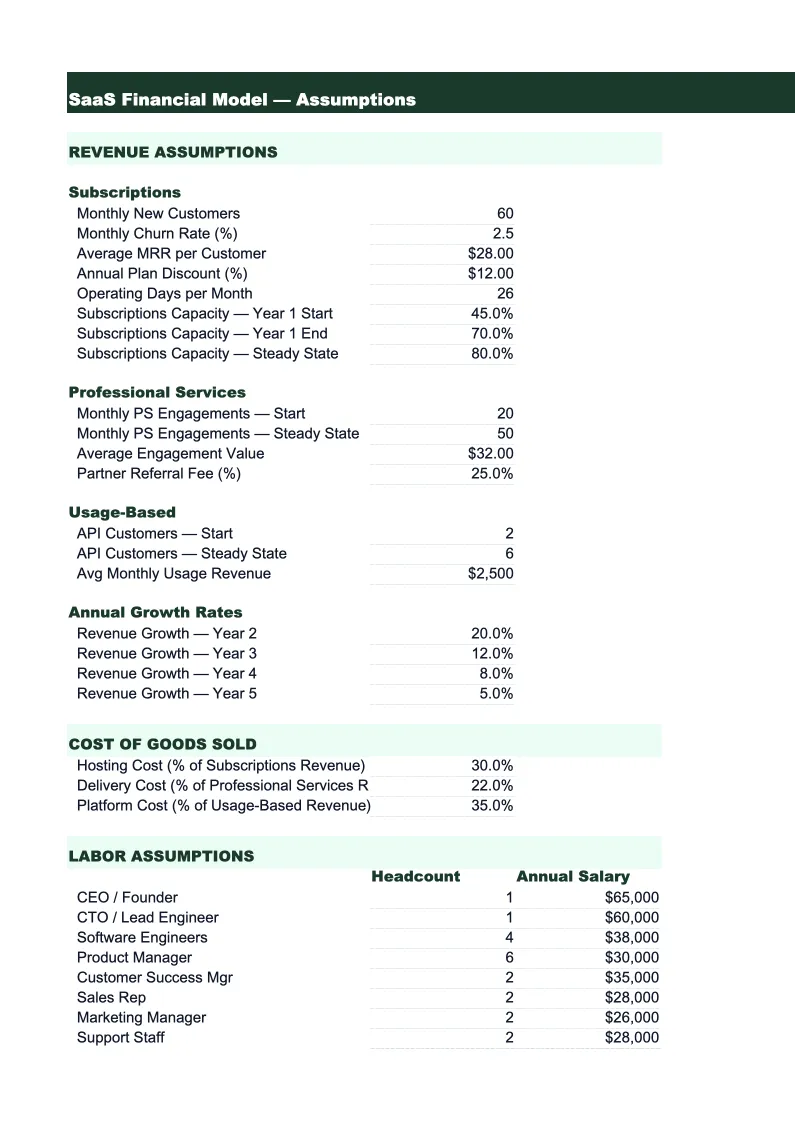
Assumptions
The control panel for the entire model.
MRR Model
A month-by-month subscription revenue build that tracks new MRR, expansion MRR, contraction MRR, and churned MRR separately — the four components of net new MRR.
Unit Economics
The metrics that tell you whether your business is fundamentally healthy: Customer Acquisition Cost (CAC), Customer Lifetime Value (LTV), LTV:CAC ratio, and CAC payback period in months.
P&L
A 24-month income statement built for SaaS economics.
Cash Flow
A monthly cash flow statement that starts with operating cash flow (net income adjusted for non-cash items), adds investing activities (equipment, capitalized development costs), and financing activities (funding rounds, debt).
Headcount Plan
A department-by-department hiring plan with start dates, salary, benefits load (typically 20–25% of base for US-based employees), and total fully-loaded cost per person.
Dashboard
A one-page summary with charts and key metrics designed for board meetings, investor updates, or internal reviews.
SaaS Financial Model Template Features
- MRR waterfall: new, expansion, contraction, and churned MRR tracked separately
- Unit economics calculator: CAC, LTV, LTV:CAC ratio, and payback period
- 3-statement model: P&L, cash flow, and balance sheet linked
- Headcount plan by department with fully-loaded salary costs
- Scenario planning via centralized assumptions sheet
- SaaS KPI dashboard with ARR, NRR, burn rate, and runway
How to Use This SaaS Financial Model Spreadsheet
Start with the Assumptions sheet — that's the only place you need to enter data to get the model running. Fill in your current MRR, monthly new customer additions, average selling price, gross revenue churn rate, and a rough headcount plan by department. Don't overthink the inputs on day one. Use last month's actuals where you have them and make your best estimates for the rest. The model is designed to be updated as your numbers change, so rough inputs now are fine.
Once assumptions are in, review the MRR Model sheet to see if the growth curve looks right. If the numbers seem too aggressive or too conservative, adjust your monthly new customer or churn inputs until the trajectory matches your gut. Then move to the P&L sheet and check whether your cost structure and burn rate make sense relative to revenue. The Headcount Plan sheet is where you'll spend the most time if you're doing a detailed forecast — work through your hiring plan quarter by quarter and let the model price out the burn impact.
15 minutes from download to your first SaaS forecast
Download the template, plug in your MRR and growth assumptions, and see your full financial picture — unit economics, P&L, cash runway, and SaaS KPIs included.
Why Every SaaS Business Needs a Financial Model
SaaS companies live or die on a handful of metrics that generic financial models weren't built to track. MRR growth rate, net revenue retention, CAC payback period, and gross margin tell you whether your business is healthy — but you can't calculate them reliably without a model that understands how subscription revenue works. Generic templates treat revenue as a single line; SaaS revenue is a waterfall of new customers added, expansions, contractions, and churn, and the net of those four numbers is what actually matters. A purpose-built model shows you that picture month by month.
The unit economics calculation is where most founders either build confidence or discover a structural problem. LTV:CAC above 3x and a CAC payback under 18 months are the benchmarks most early-stage investors use as a baseline for healthy growth. If your payback period is 36 months, you need either a lower CAC (more efficient sales and marketing spend), higher average contract value, or lower churn — and a financial model lets you see which lever moves the number most. Without this calculation tied to your actual revenue and spending data, you're operating on assumptions that may not hold.
SaaS Industry at a Glance
Financial templates built for software-as-a-service businesses managing subscription billing, ARR growth, and recurring revenue operations.
Revenue Drivers
- monthly recurring revenue (MRR)
- annual contract value (ACV)
- seat-based or usage-based billing
- professional services and onboarding fees
- add-ons and tier upgrades
Key Cost Categories
- cloud infrastructure (AWS, GCP, Azure)
- employee salaries and benefits (engineering, sales, CS, marketing)
- customer acquisition (ads, events, SDR costs)
- SaaS tools and subscriptions
- payment processing fees
- R&D and product development
Typical Margins
Gross: 60-80% · Net: -5% to 20% depending on growth stage
Seasonality
Relatively flat month-to-month with Q4 spikes from enterprise budget cycles. Annual contract renewals cluster in January and July.
Key Performance Indicators
SaaS Financial Model Template FAQ
More SaaS Templates
SaaS Balance Sheet Template for Excel
$29
SaaS Budget Template for Excel
$29
SaaS Business Plan Template for Excel
$39
SaaS Cash Flow Template for Excel
$29
SaaS Expense Tracker Template for Excel
$29
SaaS Income Statement Template for Excel
$29
SaaS Invoice Template for Excel
$29
SaaS KPI Dashboard Template for Excel
$29
SaaS P&L Template for Excel
$29
SaaS Pro Forma Template for Excel
$29
SaaS Project Budget Template for Excel
$29
SaaS Sales Forecast Template for Excel
$29
SaaS Valuation Template for Excel
$29
More Financial Model Templates
SaaS Financial Model Template
$29