Trucking Budget Template
Plan and track your trucking company's finances with a budget template built around per-mile costs, fuel, driver settlements, and freight revenue.
What's Inside This Trucking Budget Template
This template includes 5 worksheets, each designed for a specific part of your trucking financial workflow:
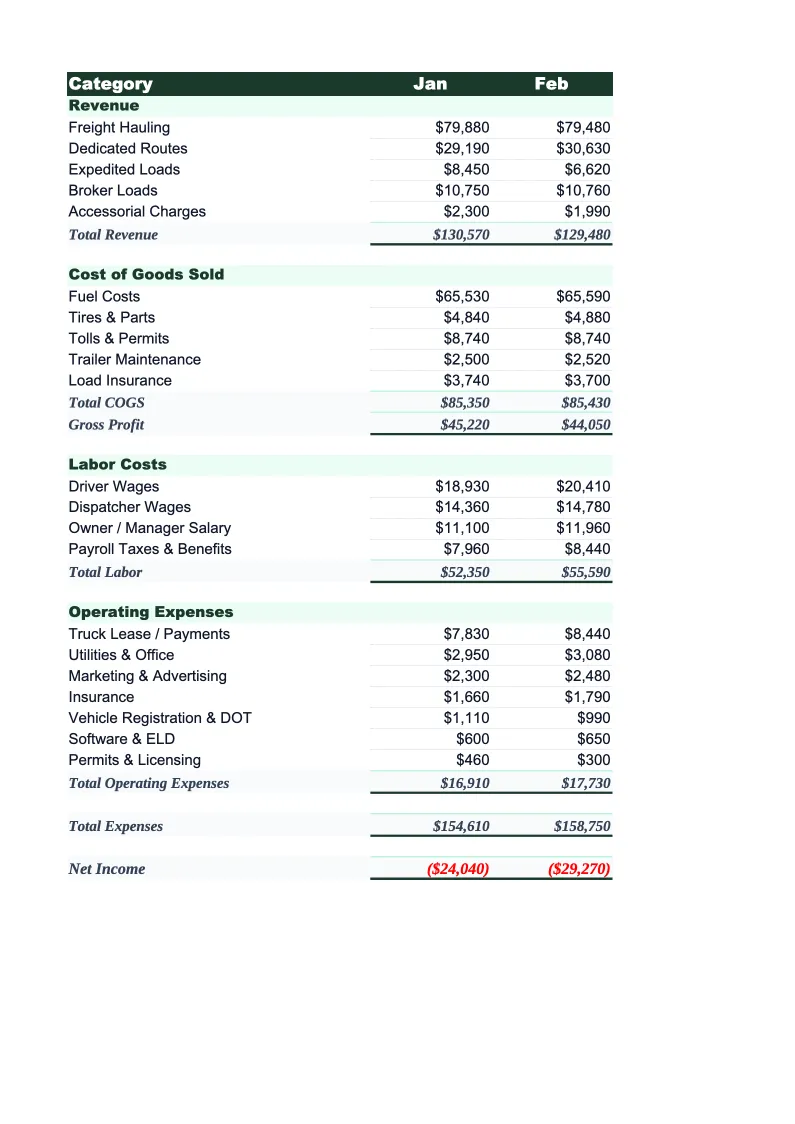
Monthly Budget
The core worksheet where you plan each month's revenue and expenses using trucking-specific categories.
Annual Summary
A 12-month rollup that pulls from each monthly sheet automatically.
Budget vs Actual
Track what you planned against what actually happened, line item by line item.
Per-Mile Cost Calculator
A dedicated worksheet that breaks down your total cost per mile (CPM) and revenue per mile (RPM) for the period.
Dashboard
A visual overview with pre-built charts showing revenue per mile, cost per mile, operating ratio, fuel cost trend, and expense category breakdown by month.
Trucking Budget Template Features
- Pre-built freight revenue categories including fuel surcharge and accessorials
- Per-mile cost calculator with CPM and RPM auto-calculations
- Operating ratio tracking across all 12 months
- Driver wage and settlement expense tracking
- Budget vs actual variance for fuel, maintenance, and insurance
- ATRI benchmark reference for per-mile cost comparison
How to Use This Trucking Budget Spreadsheet
Getting started takes about 15 minutes. Download the .xlsx file and open it in Excel or Google Sheets — no macros or plugins required. Start with the Monthly Budget sheet: review the pre-loaded revenue and expense categories and adjust them to match your operation. Owner-operators typically keep the structure as-is. Small fleets might add line items for lease-on driver costs or broker fees. Most of the categories apply directly off the shelf.
Once the categories look right, enter your projected miles for the month — that's the key driver for everything else. Input your expected revenue from freight, fuel surcharges, and any accessorials, then fill in your expense projections for fuel, driver pay, insurance, maintenance, and equipment costs. The Per-Mile Cost Calculator sheet does the math for you: it shows your projected CPM and RPM side by side so you can see at a glance whether the month pencils out before you run a single mile.
15 minutes from download to your first trucking budget
Download the template, enter your miles and load rates, and see your operation's full cost-per-mile picture before you accept the next load.
Why Every Trucking Company Needs a Budget Template
Trucking is a margin-thin business. The American Transportation Research Institute (ATRI) reports average trucking net margins of 2.5–6% for for-hire carriers, meaning a $500,000-per-year operation might net $12,500–$30,000 after all costs. At those margins, a diesel price swing of $0.20 per gallon or an unexpected engine repair can wipe out a month of profit. Most trucking companies that struggle financially don't fail because they can't win freight — they fail because they don't know their true cost per mile and price their loads accordingly.
A proper trucking budget is built around per-mile economics, not just total dollar amounts. Every major expense category behaves differently on a per-mile basis: fuel is your largest variable cost, typically running $0.40–$0.65 per mile depending on fuel prices and MPG; driver wages run $0.35–$0.55 per mile for company drivers or 25–30% of linehaul for percentage-pay drivers; maintenance averages $0.15–$0.20 per mile on a well-maintained truck but spikes unpredictably. Knowing your CPM by category tells you whether you can afford to take a load at a given rate — a calculation that's impossible without a structured budget.
Trucking Industry at a Glance
Financial templates built for trucking companies and owner-operators — pre-loaded with freight billing, fuel surcharge, and per-mile cost categories.
Revenue Drivers
- Linehaul freight rates
- Fuel surcharge revenue
- Accessorial charges
- Dedicated contract lanes
Key Cost Categories
- Driver wages & settlements
- Fuel
- Maintenance & repairs
- Insurance (liability, cargo, physical damage)
- Equipment payments & depreciation
- Permits & compliance fees
Typical Margins
Gross: 12-20% · Net: 2.5-8%
Seasonality
Peak freight volumes in August–October (back-to-school and holiday restocking) and late November–December. Slowest in January–March post-holiday.
Key Performance Indicators
Trucking Budget Template FAQ
More Trucking Templates
Trucking Balance Sheet Template for Excel
$29
Trucking Business Plan Template for Excel
$39
Trucking Cash Flow Template for Excel
$29
Trucking Expense Tracker Template for Excel
$29
Trucking Financial Model Template for Excel
$29
Trucking Income Statement Template for Excel
$29
Trucking Invoice Template for Excel
$29
Trucking KPI Dashboard Template for Excel
$29
Trucking P&L Template for Excel
$29
Trucking Pro Forma Template for Excel
$29
Trucking Project Budget Template for Excel
$29
Trucking Sales Forecast Template for Excel
$29
Trucking Company Valuation Template for Excel
$29
Trucking Budget Template
$29