Trucking KPI Dashboard Template
Track cost per mile, revenue per mile, operating ratio, and truck utilization in one place — built specifically for trucking companies and owner-operators.
What's Inside This Trucking KPI Dashboard Template
This template includes 6 worksheets, each designed for a specific part of your trucking financial workflow:
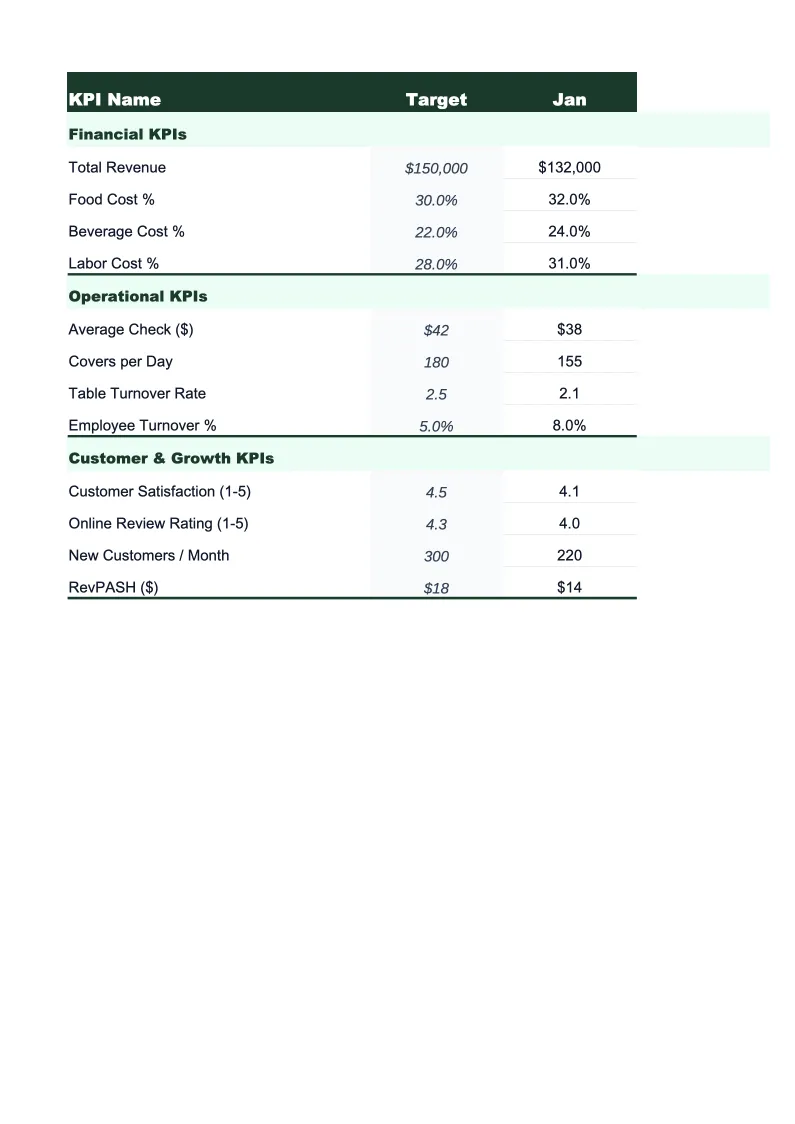
KPI Dashboard
The main visual overview showing your trucking operation's key performance indicators at a glance.
Operational Metrics
Tracks the daily and weekly operational inputs that drive financial performance — total miles driven, loaded miles vs.
Financial KPIs
Calculates your core financial metrics from revenue and expense inputs: cost per mile (total and broken out by fuel, maintenance, driver, and fixed costs), revenue per mile, gross and net operating ratio, and fuel cost as a percentage of total revenue.
Fleet Breakdown
Tracks performance on a per-truck basis, showing CPM, RPM, miles driven, and utilization rate for each unit in your fleet.
Monthly Trends
A rolling 12-month view of all financial KPIs — CPM, RPM, operating ratio, fuel cost percentage, and gross revenue — with period-over-period variance calculated automatically.
Data Entry
The input sheet where you enter monthly revenue and expense figures — linehaul revenue, fuel surcharge collected, accessorial charges, driver pay and settlements, fuel costs, maintenance, insurance, equipment payments, permits, and other overhead.
Trucking KPI Dashboard Template Features
- Cost per mile calculated automatically — total and broken out by fuel, driver, maintenance, and fixed costs
- Operating ratio tracking with color-coded on/off-target indicators
- Deadhead miles tracked separately to measure empty-mile efficiency
- Per-truck fleet breakdown to identify underperforming units
- 12-month rolling trend view for CPM, RPM, and operating ratio
- Revenue per mile vs. cost per mile comparison chart built in
How to Use This Trucking KPI Spreadsheet
Start by entering your fleet details in the Data Entry sheet — your trucks, drivers, and the expense categories that match how you actually track costs. Most trucking operations will find the pre-loaded categories (fuel, driver settlements, maintenance, insurance, equipment payments, permits) map directly to their existing bookkeeping. If you run a single truck, the setup takes about 10 minutes. If you're entering data for a fleet of 5 or 10 trucks, plan for 20–30 minutes on the first setup.
Each month, enter your revenue and expense totals in the Data Entry sheet — linehaul revenue, fuel surcharge collected, total miles driven, deadhead miles, and each expense category. If you have QuickBooks or a bookkeeping spreadsheet, you can copy numbers across in a few minutes. The Financial KPIs sheet will automatically calculate your CPM, RPM, and operating ratio; the Fleet Breakdown sheet will update each truck's performance; and the KPI Dashboard will refresh all charts and indicators.
15 minutes from download to your first trucking KPI report
Download the template, enter your monthly numbers, and see your cost per mile, operating ratio, and fleet performance in one dashboard.
Why Every Trucking Operation Needs a KPI Dashboard
Trucking is one of the most metrics-driven industries in small business, but most owner-operators and small carriers track performance the wrong way — looking at bank balance instead of cost per mile. The problem is that revenue can look healthy while CPM quietly rises due to fuel price increases, aging equipment, or inefficient routing. By the time the bank balance reflects the problem, you've already absorbed months of margin erosion. A structured KPI dashboard turns lagging indicators (bank balance, quarterly P&L) into leading ones (CPM trend, deadhead percentage, operating ratio).
The metrics that matter most in trucking are CPM, RPM, operating ratio, and loaded mile percentage. CPM should typically run 25–40% below your RPM to generate an acceptable net margin — for most carriers in dry van or flatbed, that means an operating ratio under 0.90, ideally under 0.85. Fuel usually accounts for 20–28% of total operating costs, which means even small fuel price swings have outsized impact on your net. Deadhead miles above 15–20% of total miles driven are a strong signal that routing or load planning can be improved. This template tracks all of these automatically so you don't have to calculate them manually each month.
Trucking Industry at a Glance
Financial templates built for trucking companies and owner-operators — pre-loaded with freight billing, fuel surcharge, and per-mile cost categories.
Revenue Drivers
- Linehaul freight rates
- Fuel surcharge revenue
- Accessorial charges
- Dedicated contract lanes
Key Cost Categories
- Driver wages & settlements
- Fuel
- Maintenance & repairs
- Insurance (liability, cargo, physical damage)
- Equipment payments & depreciation
- Permits & compliance fees
Typical Margins
Gross: 12-20% · Net: 2.5-8%
Seasonality
Peak freight volumes in August–October (back-to-school and holiday restocking) and late November–December. Slowest in January–March post-holiday.
Key Performance Indicators
Trucking KPI Dashboard Template FAQ
More Trucking Templates
Trucking Balance Sheet Template for Excel
$29
Trucking Budget Template for Excel
$29
Trucking Business Plan Template for Excel
$39
Trucking Cash Flow Template for Excel
$29
Trucking Expense Tracker Template for Excel
$29
Trucking Financial Model Template for Excel
$29
Trucking Income Statement Template for Excel
$29
Trucking Invoice Template for Excel
$29
Trucking P&L Template for Excel
$29
Trucking Pro Forma Template for Excel
$29
Trucking Project Budget Template for Excel
$29
Trucking Sales Forecast Template for Excel
$29
Trucking Company Valuation Template for Excel
$29
More KPI Dashboard Templates
Trucking KPI Dashboard Template
$29