Trucking P&L Template
Track your trucking company's freight revenue, fuel costs, driver wages, and net income with a P&L template built around per-mile metrics — not a generic spreadsheet you have to rebuild from scratch.
What's Inside This Trucking P&L Template
This template includes 4 worksheets, each designed for a specific part of your trucking financial workflow:
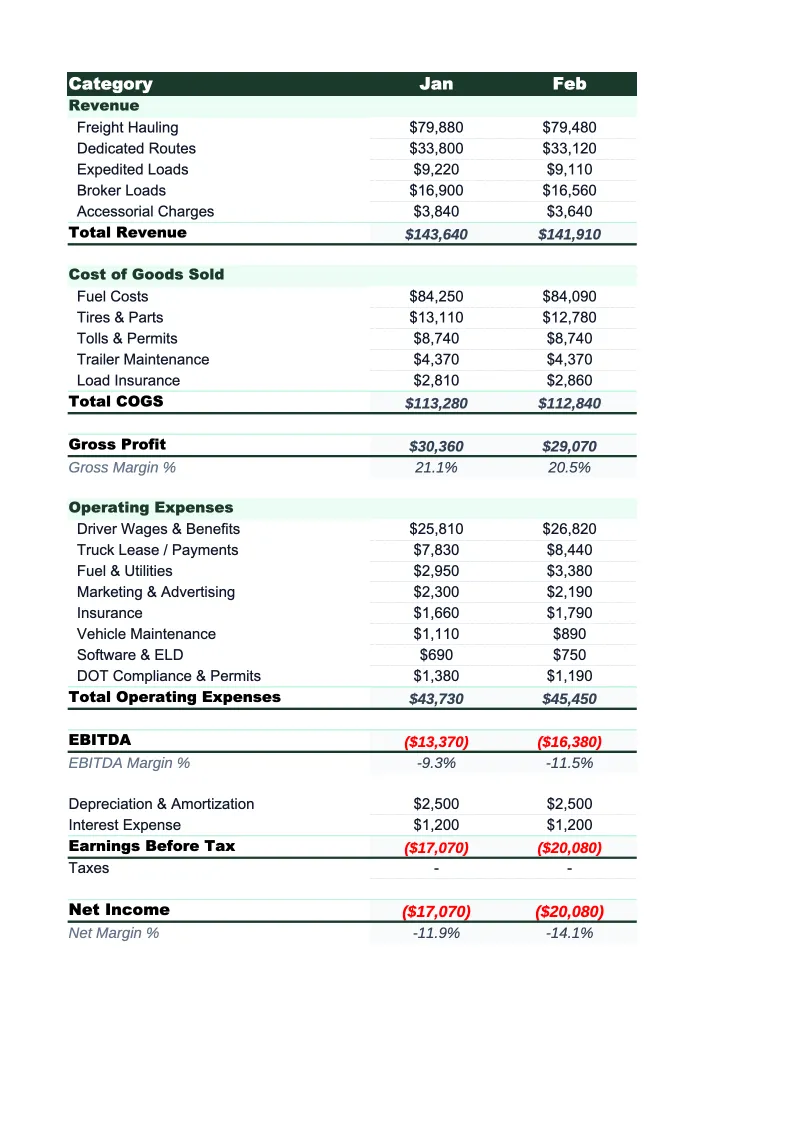
Monthly P&L
The main worksheet where you enter each month's revenue and expenses.
Annual P&L
A 12-month summary that pulls automatically from the Monthly P&L sheet.
Per-Mile Cost Tracker
A dedicated worksheet that calculates your cost per mile (CPM) and revenue per mile (RPM) by expense category.
Dashboard
A one-page visual summary with pre-built charts and key financial metrics for the month and year to date.
Trucking P&L Template Features
- Revenue split by linehaul, fuel surcharge, and accessorial charges
- Operating ratio calculated automatically each month
- Cost per mile (CPM) and revenue per mile (RPM) by expense category
- Driver wage and per-mile settlement tracking
- 12-month annual P&L view with full-year totals
- Visual dashboard with fuel cost %, operating ratio, and margin trends
How to Use This Trucking P&L Spreadsheet
Download the .xlsx file and open it in Excel or Google Sheets — no macros or add-ins required. Start with the Monthly P&L sheet and review the pre-loaded revenue and expense categories. Most trucking operations can use the template as-is with minor adjustments: rename accessorial charge types to match what you bill, add or remove equipment payment rows if you run more or fewer trucks, and adjust the driver pay structure to match whether you pay per mile, hourly, or by percentage of load. Initial setup typically takes 15–20 minutes.
Each month, pull your freight invoices, fuel receipts, and expense records and enter the totals by category. If you use transportation management software (TMS) or an ERP, most can export a monthly expense summary you can use as your source. Fill in your total miles driven for the month in the Per-Mile Cost Tracker sheet — that unlocks the CPM and RPM calculations that tell you what each loaded and empty mile actually costs. These numbers are the foundation of good rate negotiation and load selection.
15 minutes from download to your first P&L
Download the template, enter last month's freight revenue and expenses, and see your operating ratio and cost per mile calculated automatically.
Why Every Trucking Company Needs a P&L Template
Trucking runs on thinner margins than most industries realize — the average net profit margin for carriers sits between 2.5% and 8%, and fuel alone can consume 25–35% of revenue in a given month. At those margins, a 2-cent rise in diesel prices, an unscheduled breakdown, or a month of running too many empty miles can flip a profitable quarter into a break-even one. Without a structured P&L to review each month, those problems stay invisible until they've already done their damage.
A trucking P&L has a specific structure that generic business templates don't reflect. Revenue needs to separate linehaul freight from fuel surcharges, because fuel surcharges are meant to offset fuel costs — if your fuel surcharge revenue and actual fuel costs are misaligned, you're either leaving money on the table or billing incorrectly. Accessorial charges (detention, layover, TONU) are often the most overlooked revenue category, and they matter more as freight markets tighten. On the cost side, expenses need to track per mile — not just as monthly totals — because the measure that drives profitability decisions in trucking is cost per mile, not cost per month.
Trucking Industry at a Glance
Financial templates built for trucking companies and owner-operators — pre-loaded with freight billing, fuel surcharge, and per-mile cost categories.
Revenue Drivers
- Linehaul freight rates
- Fuel surcharge revenue
- Accessorial charges
- Dedicated contract lanes
Key Cost Categories
- Driver wages & settlements
- Fuel
- Maintenance & repairs
- Insurance (liability, cargo, physical damage)
- Equipment payments & depreciation
- Permits & compliance fees
Typical Margins
Gross: 12-20% · Net: 2.5-8%
Seasonality
Peak freight volumes in August–October (back-to-school and holiday restocking) and late November–December. Slowest in January–March post-holiday.
Key Performance Indicators
Trucking P&L Template FAQ
More Trucking Templates
Trucking Balance Sheet Template for Excel
$29
Trucking Budget Template for Excel
$29
Trucking Business Plan Template for Excel
$39
Trucking Cash Flow Template for Excel
$29
Trucking Expense Tracker Template for Excel
$29
Trucking Financial Model Template for Excel
$29
Trucking Income Statement Template for Excel
$29
Trucking Invoice Template for Excel
$29
Trucking KPI Dashboard Template for Excel
$29
Trucking Pro Forma Template for Excel
$29
Trucking Project Budget Template for Excel
$29
Trucking Sales Forecast Template for Excel
$29
Trucking Company Valuation Template for Excel
$29
Trucking P&L Template
$29