Trucking Financial Model Template
Model fleet revenue by truck, track cost per mile against rate per mile, and project cash flow — built for carrier owners, owner-operators, and trucking company managers.
What's Inside This Trucking Financial Model Template
This template includes 8 worksheets, each designed for a specific part of your trucking financial workflow:
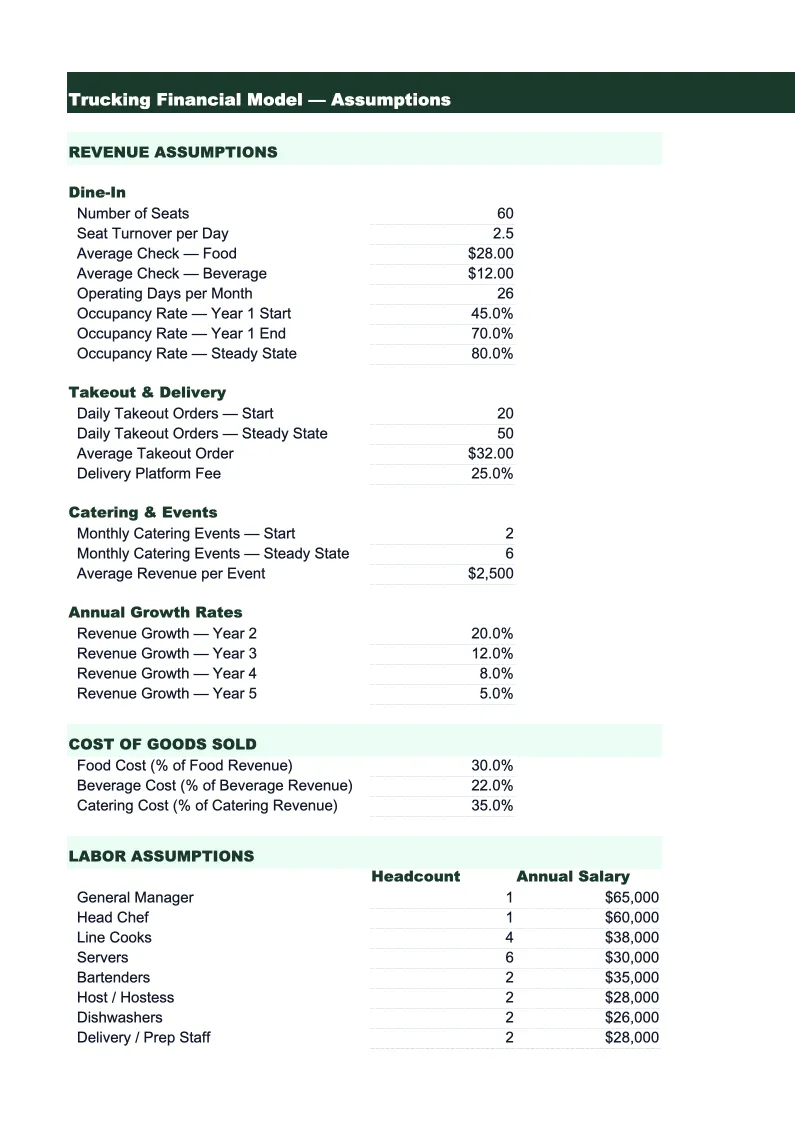
Assumptions
The central control panel for the entire model. Enter your fleet size, average loaded miles per truck per month, target load rate per mile (linehaul rate), fuel surcharge rate structure (percentage of linehaul or flat cents per mile), empty mile percentage, and driver pay structure (company driver cents-per-mile rate or owner-operator settlement percentage). Also includes inputs for average fuel price per gallon and miles per gallon by truck type, insurance premium allocation per truck, and monthly fixed overhead. Changing any assumption here flows through every downstream sheet automatically — so you can run scenarios like adding two trucks, increasing your linehaul rate by $0.05/mile, or modeling the impact of a fuel spike from $4.00 to $4.75 per gallon without editing a single formula.
Fleet & Revenue
A truck-by-truck revenue schedule for up to 20 power units. Each row shows a single truck's projected loaded miles, empty miles, utilization rate (loaded miles as a percentage of total available miles), linehaul revenue at your target rate, fuel surcharge revenue, and total accessorial charges (detention, layover, TONU, lumper reimbursements, and oversize permits). Monthly revenue per truck is summed across the fleet, and revenue per available truck — a productivity metric that accounts for trucks in maintenance or off the road — is calculated automatically. A truck utilization heatmap by month highlights which units are running below 85% loaded utilization, the threshold where most carriers start losing money on fixed costs. The sheet also shows total fleet miles, which drives fuel consumption and tire cost calculations in the variable cost section.
Driver & Labor Costs
A detailed breakdown of driver compensation by pay structure — company drivers paid on a cents-per-mile basis, company drivers on a salary or daily guarantee, and owner-operators paid as a percentage of linehaul revenue (typically 70–80% of gross). For company drivers, the sheet calculates total driver pay from the CPM rate and projected miles, then applies a payroll burden rate (federal and state payroll taxes, workers' comp, and benefits where applicable) to arrive at fully loaded driver labor cost. For owner-operators, the settlement calculation uses your percentage split and deducts base plate, IFTA, and insurance escrow contributions that carriers commonly withhold. Non-driver staff — dispatcher, safety manager, office admin — are listed separately with salary and burden. Total labor cost per mile is shown at the bottom of the sheet and feeds directly into the per-mile cost summary on the P&L.
Fuel & Variable Costs
A monthly projection of all variable operating costs — costs that scale directly with miles driven. Fuel cost is calculated from total fleet miles, fleet average miles per gallon, and the fuel price per gallon entered in Assumptions; the model also shows net fuel cost after subtracting fuel surcharge revenue collected from shippers, because the surcharge is designed to offset fuel exposure. Below fuel: tire cost per mile (typically $0.03–$0.05 per mile for truckload), driver-related expenses like per diem and scale fees, and maintenance and repair costs modeled as a cents-per-mile reserve (industry standard is $0.12–$0.18 per mile for tractors under 500,000 miles, rising as units age). Each variable cost line shows both the monthly dollar amount and the cents-per-mile equivalent — the format that trucking operations managers use to compare costs against peers and benchmark pricing decisions.
Fixed Costs & Overhead
A monthly detail of all fixed and semi-fixed operating costs — costs that continue regardless of how many miles the fleet runs. Equipment costs include monthly loan or lease payments per truck and trailer, modeled by unit count, and depreciation if you own equipment outright. Insurance shows combined premium for liability (typically the largest line item for carriers), cargo, physical damage, and bobtail, allocated both as a total monthly premium and as a cost per truck. Compliance costs include FMCSA operating authority fees, IFTA quarterly tax accruals, IRP (apportioned registration), DOT drug and alcohol testing program costs, and ELD subscription fees. Office overhead covers dispatch software, load board subscriptions (DAT, Truckstop), factoring fees if applicable, rent, utilities, and any office headcount not included in the labor sheet. Total fixed costs per truck per month and per mile are calculated, giving a clear picture of how much revenue each truck must generate just to cover its fixed cost burden.
P&L
A 24-month income statement structured around the per-mile metrics that trucking operators and lenders use to assess carrier performance. Revenue is shown by component: linehaul revenue, fuel surcharge revenue, and accessorial revenue. Below revenue, direct costs are broken into driver compensation, fuel (net of surcharge), variable operating costs (tires, maintenance reserve, driver expenses), and equipment costs. Gross profit is shown after direct costs, then fixed overhead and G&A expenses are deducted to arrive at operating income. The model calculates revenue per mile (RPM), cost per mile (CPM), and net cents per mile for each month — the core KPIs used to compare performance against industry benchmarks. Operating ratio (total operating expenses divided by total revenue, expressed as a percentage) is calculated automatically; carriers targeting profitability should be below 95%, and best-in-class carriers operate below 88%.
Cash Flow
A monthly cash flow statement that models the receivables timing and financing structure common in trucking. Many carriers factor their receivables (selling invoices to a factoring company at 2–4% discount for immediate payment), while others bill shippers directly on net-30 to net-60 terms. The cash flow sheet lets you toggle between factoring and direct billing, with factoring showing an immediate cash receipt minus the discount fee, and direct billing showing a 30–45 day collection lag. Outflows model driver payroll on a weekly cycle (the most common payroll frequency in trucking), weekly fuel card settlements (often the largest single weekly cash outflow), monthly insurance premiums, and quarterly IFTA payments. Equipment loan payments are shown separately from operating expenses. The model tracks your running cash balance and flags months where operating cash flow turns negative due to rate compression, low utilization, or high fuel costs — the scenarios that catch undercapitalized carriers off guard.
KPI Dashboard
A one-page visual summary of the metrics that trucking owner-operators, fleet managers, and investors track most closely. Charts included: revenue per mile vs. cost per mile trend over the forecast period, operating ratio by month, and fleet utilization rate. Key metrics displayed at the top: current month total revenue, net cents per mile, operating ratio, fuel cost as a percentage of gross revenue, and average revenue per truck. A per-truck performance table shows each unit's revenue, loaded miles, empty mile percentage, and gross contribution — useful for identifying which trucks are profitable and which are dragging down overall margins. All metrics pull automatically from the underlying sheets. The dashboard is formatted to be presentable for bank reviews, SBA loan applications, or fleet owner-operator discussions about rates and settlements.
Trucking Financial Model Template Features
- Truck-by-truck revenue model with loaded miles, utilization rate, and fuel surcharge calculation for up to 20 power units
- Driver pay model supporting CPM, daily guarantee, and owner-operator percentage settlement structures
- Per-mile cost breakdown — fuel, tires, maintenance reserve, driver expenses — in both dollar and cents-per-mile format
- Fixed cost model covering equipment loans, insurance by coverage type, IFTA, IRP, ELD, and load board subscriptions
- Cash flow statement with factoring vs. direct billing toggle to model receivables timing impact
- KPI Dashboard with operating ratio, revenue per mile, cost per mile, and fuel cost as a percentage of gross revenue
How to Use This Trucking Financial Model Spreadsheet
Start with the Assumptions sheet. Enter your current fleet size, average linehaul rate per mile, fuel price, and miles per gallon. Set your driver pay structure — if you run company drivers, enter your CPM rate; if you use owner-operators, enter your settlement percentage. Don't worry about getting every number perfect on day one. Use your last three months of operating data as the baseline: look at your average loaded miles per truck, your average rate confirmation, and your monthly fuel spend. These three inputs drive 80% of the model's outputs. The Assumptions sheet is designed so that a fleet owner or owner-operator with a basic understanding of their own numbers can be fully set up in 20–30 minutes.
With your assumptions in place, move to the Fleet & Revenue sheet and enter each truck by unit number or driver name. Review the utilization rate for each unit — if a truck is showing below 85% loaded utilization, check whether that's realistic or whether you need to adjust your projected miles. Move through the Driver & Labor sheet to confirm your compensation model is set up correctly, then review the Fixed Costs sheet to make sure all insurance, equipment, and compliance costs are included. The P&L sheet will populate automatically. Pay close attention to the operating ratio — if it's coming in above 95%, the model is showing you that your current rate structure or cost base doesn't support profitability at your projected volume.
Use the model monthly as an operational check. After each month closes, update the Fleet & Revenue sheet with actual loaded miles and rates, and update the fuel and variable cost columns with actual spend. The P&L will show you immediately how your actual RPM and CPM compare to your projections, and the KPI Dashboard will update all your key metrics. Trucking is a low-margin business where small changes in rate per mile or fuel cost have outsized effects on net income — a $0.05/mile rate increase on a 10,000-mile-per-month truck adds $500 per month per truck in revenue. This model makes those relationships visible so you can make pricing, dispatch, and fleet size decisions based on numbers rather than intuition.
15 minutes from download to your first per-mile cost breakdown
Download the template, enter your fleet size and current rates, and see your trucking company's full financial picture — operating ratio, cost per mile, and cash position included.
Why Every Trucking Company Needs a Financial Model
Trucking operates on some of the thinnest margins in any industry — net margins of 2.5–8% mean a carrier doing $2 million in revenue might net $50,000–$160,000 after all costs. At those margins, the difference between a profitable month and a loss comes down to a few cents per mile: your rate per mile versus your cost per mile. Most trucking companies track revenue in their TMS (transportation management system) and fuel spend on their fuel card, but very few model the full picture — what it actually costs to run each truck after driver pay, insurance, equipment, compliance, and overhead are accounted for. Without that full view, carriers routinely accept loads that look profitable based on the linehaul rate but lose money once all-in costs are included.
The financial metrics that define a healthy trucking operation are different from most businesses. Operating ratio — total operating expenses divided by total revenue — is the primary health indicator. Industry benchmarks: below 88% is best-in-class, 88–94% is typical for well-run carriers, above 95% signals structural problems with rate quality, cost control, or utilization. Cost per mile is the foundational unit of analysis, typically broken into fuel (historically $0.45–$0.65/mile for diesel), driver compensation ($0.35–$0.55/mile for company drivers), fixed costs per mile ($0.25–$0.45/mile depending on equipment financing), and variable maintenance and tires ($0.15–$0.22/mile). Revenue per mile must cover all of these to generate net income. Carriers that don't track CPM by category can't identify which cost is out of line when margins compress.
For owner-operators and small carriers seeking equipment financing, SBA loans, or factoring relationships, a financial model is often the document that determines approval and terms. Factoring companies assess your invoice volume and typical shippers to set advance rates and fees. Equipment lenders look at revenue per truck, operating ratio, and working capital adequacy. SBA 7(a) trucking loans require multi-year cash flow projections. A model that clearly shows your revenue per mile, cost per mile, and operating ratio — with realistic assumptions tied to your actual operating data — is far more persuasive than a bank statement alone. It demonstrates that you understand your business economics and have a plan for sustainable profitability at your projected fleet size.
Trucking Industry at a Glance
Financial templates built for trucking companies and owner-operators — pre-loaded with freight billing, fuel surcharge, and per-mile cost categories.
Revenue Drivers
- Linehaul freight rates
- Fuel surcharge revenue
- Accessorial charges
- Dedicated contract lanes
Key Cost Categories
- Driver wages & settlements
- Fuel
- Maintenance & repairs
- Insurance (liability, cargo, physical damage)
- Equipment payments & depreciation
- Permits & compliance fees
Typical Margins
Gross: 12-20% · Net: 2.5-8%
Seasonality
Peak freight volumes in August–October (back-to-school and holiday restocking) and late November–December. Slowest in January–March post-holiday.
Key Performance Indicators
Trucking Financial Model Template FAQ
More Trucking Templates
Trucking Balance Sheet Template for Excel
$29
Trucking Budget Template for Excel
$29
Trucking Cash Flow Template for Excel
$29
Trucking Income Statement Template for Excel
$29
Trucking Invoice Template for Excel
$29
Trucking KPI Dashboard Template for Excel
$29
Trucking P&L Template for Excel
$29
Trucking Pro Forma Template for Excel
$29
Trucking Project Budget Template for Excel
$29
Trucking Sales Forecast Template for Excel
$29
Trucking Company Valuation Template for Excel
$29
More Financial Model Templates
Trucking Financial Model Template
$29