Trucking Cash Flow Template
Track and project cash flow for your trucking operation — with revenue split by freight lane and billing type, a freight invoice aging tracker for broker and direct-shipper receivables, per-mile cost analysis, and a 13-week projection built around how carriers actually manage fuel, driver settlements, and equipment payments.
What's Inside This Trucking Cash Flow Template
This template includes 5 worksheets, each designed for a specific part of your trucking financial workflow:
13-Week Cash Flow
A rolling 13-week cash projection covering the most practical planning window for a trucking operation.
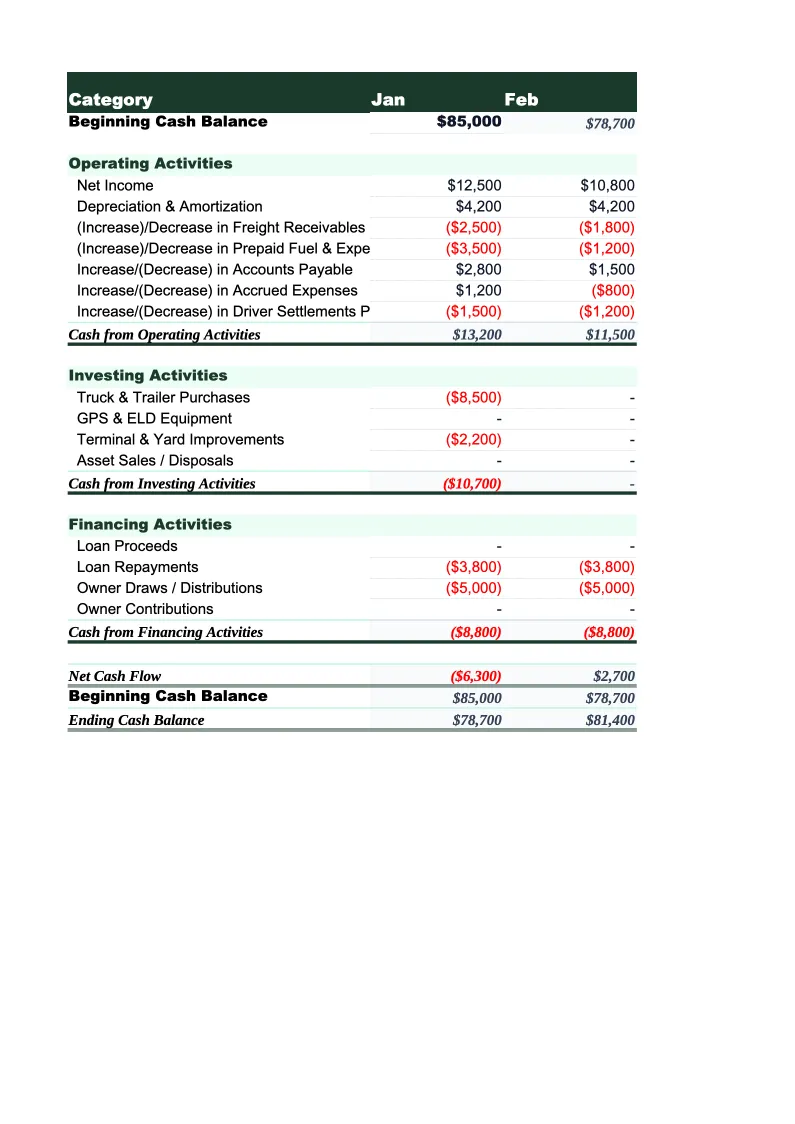
Monthly Cash Flow
A 12-month indirect-method cash flow statement organized into operating, investing, and financing activities.
Freight Invoice Tracker
A dedicated sheet for managing outstanding freight invoices and understanding your receivables position — the most common cash flow pressure point in trucking.
Per-Mile Cost Analysis
A per-truck cost breakdown that calculates your cost per mile (CPM) and compares it against your revenue per mile (RPM) to show operating margin at the load or lane level.
Annual Summary
A full-year rollup of operating cash flow broken down by revenue category and major expense line.
Trucking Cash Flow Template Features
- 13-week cash projection with freight revenue split by spot loads, broker loads, direct shipper contracts, and dedicated lanes — plus fuel surcharge tracked separately
- Freight Invoice Tracker with aging buckets (0–30, 31–45, 46–60, 60+ days), factoring fee tracking, and average days-to-pay by customer
- Per-Mile Cost Analysis calculating fixed CPM, variable CPM, and load-level gross margin for individual loads and lanes
- Accounts receivable working capital adjustment for 30–60 day freight invoice payment cycles built into the monthly indirect cash flow statement
- Operating ratio calculation and fuel cost as a percentage of revenue — the two primary financial benchmarks trucking lenders and buyers use
- IFTA fuel tax accrual rows and quarterly payment planning built into the weekly expense schedule
How to Use This Trucking Cash Flow Spreadsheet
Download the .xlsx file and open it in Excel or Google Sheets. Start with the Per-Mile Cost Analysis sheet — enter your fixed monthly costs per truck (equipment payment, insurance, base driver pay, permits) and your variable costs per mile (average fuel cost, maintenance reserve, tire allocation). This establishes your CPM baseline and tells you the minimum RPM you need to cover costs on any given load. Once your cost structure is in, move to the Freight Invoice Tracker and enter your current outstanding invoices with their expected payment dates. This gives you your receivables position, which is the single most important input for the 13-week projection in a trucking business where you may be owed $50,000–$150,000 in freight that hasn't been paid yet.
Update the 13-week projection weekly. At the start of each week, enter confirmed loads you've booked (or dispatched) for the next three weeks, their linehaul and FSC revenue, and the expected payment dates based on each broker or shipper's payment terms. Adjust your fuel expense estimate using the current diesel price and planned miles. Flag any invoices in the Freight Invoice Tracker that are past due so you know whether to chase payment directly, offer a quick-pay discount, or factor the invoice. The 13-week ending cash balance row shows you whether you'll have enough cash to cover equipment payments and driver settlements in the coming weeks — the two expense categories that can't be deferred.
15 minutes from download to your first cash flow projection
Download the template, enter your outstanding freight invoices and weekly load schedule, and see your trucking operation's full cash picture — 13-week projection, invoice tracker, per-mile cost analysis, and monthly statement included.
Why Trucking Companies Need a Dedicated Cash Flow Template
Trucking is one of the few industries where a profitable business can run out of cash. A carrier billing $100,000 per month can have $150,000 in outstanding freight invoices at any time if broker payment terms average 45 days — meaning the business has earned the money but cannot spend it until the checks arrive. Driver settlements and equipment payments don't wait for brokers to process invoices. Fuel purchases happen every day. That gap between earned revenue and collected cash is the defining cash flow challenge in trucking, and it's why carriers use invoice factoring more than almost any other industry: selling receivables for immediate cash at a 2–4% fee is often the only way to keep fuel in the tanks and drivers paid while waiting for brokers to clear invoices.
The financial metrics that matter in trucking are different from most businesses. Operating ratio — total operating expenses divided by total revenue — is the benchmark lenders, investors, and acquirers use to evaluate a carrier. An OR of 85% means the operation earns $0.15 of operating profit for every dollar of revenue, which is considered efficient in an industry with gross margins of 12–20% and net margins of 2.5–8%. Cost per mile is the operational measure: a carrier running $1.85 CPM against $2.20 RPM is generating $0.35 per mile of margin, roughly 16%, which covers fixed overhead and leaves room for a modest profit. Fuel cost as a percentage of revenue typically runs 25–35% for diesel-powered operations, and a single $0.50 move in diesel prices can shift CPM by $0.08–$0.10 — which erases margin on spot loads priced before the fuel spike.
Trucking Industry at a Glance
Financial templates built for trucking companies and owner-operators — pre-loaded with freight billing, fuel surcharge, and per-mile cost categories.
Revenue Drivers
- Linehaul freight rates
- Fuel surcharge revenue
- Accessorial charges
- Dedicated contract lanes
Key Cost Categories
- Driver wages & settlements
- Fuel
- Maintenance & repairs
- Insurance (liability, cargo, physical damage)
- Equipment payments & depreciation
- Permits & compliance fees
Typical Margins
Gross: 12-20% · Net: 2.5-8%
Seasonality
Peak freight volumes in August–October (back-to-school and holiday restocking) and late November–December. Slowest in January–March post-holiday.
Key Performance Indicators
Trucking Cash Flow Template FAQ
More Trucking Templates
Trucking Balance Sheet Template for Excel
$29
Trucking Budget Template for Excel
$29
Trucking Business Plan Template for Excel
$39
Trucking Expense Tracker Template for Excel
$29
Trucking Financial Model Template for Excel
$29
Trucking Income Statement Template for Excel
$29
Trucking Invoice Template for Excel
$29
Trucking KPI Dashboard Template for Excel
$29
Trucking P&L Template for Excel
$29
Trucking Pro Forma Template for Excel
$29
Trucking Project Budget Template for Excel
$29
Trucking Sales Forecast Template for Excel
$29
Trucking Company Valuation Template for Excel
$29
Trucking Cash Flow Template
$29