Trucking Pro Forma Template
Project revenue per mile, model fuel and driver costs at real loaded rates, and see your trucking company's cash position month by month — built for owner-operators, small fleets, and carriers preparing for financing.
What's Inside This Trucking Pro Forma Template
This template includes 8 worksheets, each designed for a specific part of your trucking financial workflow:
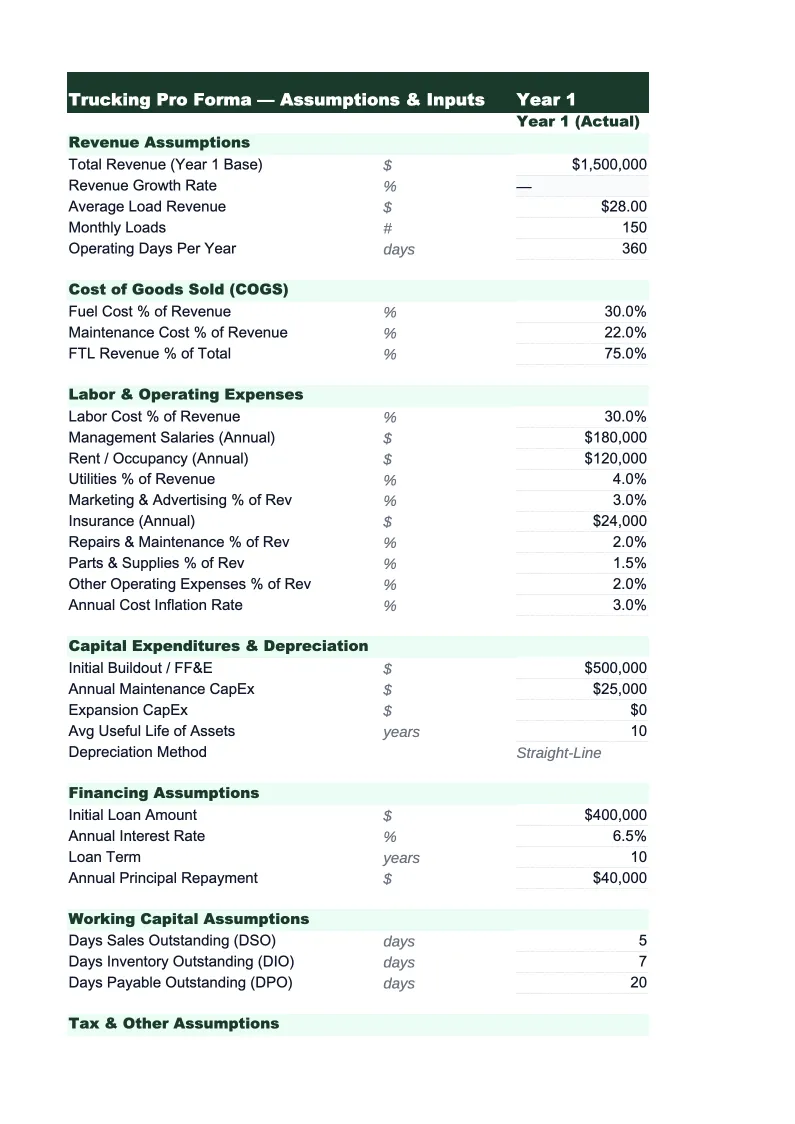
Assumptions
The central input panel that drives the entire model.
Revenue Projections
A month-by-month revenue forecast broken out by revenue type: linehaul freight revenue (the per-mile rate times loaded miles), fuel surcharge revenue (calculated from the current fuel surcharge index or a fixed percentage of linehaul), and accessorial charges (detention, lumper reimbursements, layover pay billed to customers, and any other assessorial revenue you regularly capture).
Driver & Equipment Costs
Projects the two largest cost categories in a trucking operation: driver compensation and equipment.
Fuel & Variable Costs
Tracks fuel and other variable operating costs that scale with miles.
Fixed Overhead
Captures the costs that don't scale directly with miles: liability and cargo insurance premiums (your primary commercial auto and general liability policies), USDOT and state operating authority fees, ELD hardware and software subscriptions, dispatch software or factoring fees, office or yard rent if applicable, and administrative payroll for any non-driving staff.
Monthly P&L
A full monthly income statement covering 36 months of projections.
Cash Flow Forecast
Projects your monthly cash position, which in trucking is heavily influenced by the payment terms of your freight customers and whether you're using invoice factoring.
Summary Dashboard
A single-page financial summary designed for lenders, investors, or SBA underwriters who need a clear picture without working through the full model.
Trucking Pro Forma Template Features
- Revenue modeled by linehaul, fuel surcharge, and accessorial charges with per-mile rate inputs
- Driver cost calculation with cents-per-mile or percentage-pay structures plus loaded employer costs
- Fuel expense with $0.25/gallon sensitivity toggle showing monthly P&L impact
- Operating ratio tracked monthly — the trucking industry's standard profitability benchmark
- Factored vs. unfactored receivables timing in the cash flow forecast
- 36-month P&L with cost-per-mile and revenue-per-mile benchmarks by month
How to Use This Trucking Pro Forma Spreadsheet
Start with the Assumptions sheet and configure the model for your operation. Enter your truck count, equipment type, average loaded miles per truck per week, and rate per mile — if you're on spot market, use a conservative rate based on your recent average; if you run dedicated lanes, use your contract rate. Set your empty mile percentage (typically 10–20% for well-managed routes), your fuel cost per gallon, and your miles per gallon. Enter driver pay structure — cents per mile or percentage of linehaul — and set the loaded employer cost percentage (usually 18–22% on top of driver wages for taxes, workers' comp, and benefits). If you have equipment payments, enter the monthly payment and remaining term. The entire model updates from this one sheet.
Move to the Revenue Projections sheet and review the monthly numbers. Check that the seasonal adjustments look right for your lanes — some carriers run counter-cyclically to the general freight market depending on what they haul. Then review the Driver & Equipment Costs and Fuel sheets to confirm the per-mile cost buildup looks realistic. Your total cost per loaded mile should be somewhere between $1.40 and $2.20 for most over-the-road dry van operations, though refrigerated, flatbed, and specialized freight often run higher. If your cost per mile looks wrong, trace it back to the Assumptions sheet and adjust. It's common for the first pass to surface a compensation rate or fuel efficiency number that was entered incorrectly.
15 minutes from download to your first trucking pro forma
Download the template, enter your rate per mile, fuel cost, and driver pay structure, and see your trucking operation's full three-year financial picture — P&L, cash flow, and operating ratio included.
Why Every Trucking Business Needs a Pro Forma
Trucking is one of the few industries where you can be busy all year and still lose money — because the margin between revenue per mile and cost per mile is thin enough that a 10% swing in fuel prices or a 5% increase in driver pay can wipe out net income entirely. Owner-operators and small fleet owners who run the business on feel rather than a monthly financial model often find out too late that a combination of rising diesel prices, a soft freight market, and an unexpected truck repair has pushed their operating ratio above 100 — meaning they're spending more than they're earning. A trucking pro forma builds the math explicitly before that happens, so you know what rate per mile you need to be profitable at current fuel and driver costs, and what your break-even load factor is for each truck.
The key financial relationships in trucking are all per-mile. Revenue per mile (RPM) is your gross revenue divided by total miles including deadhead; cost per mile (CPM) is your total operating expenses divided by the same total miles. The gap between them — your net per mile — is the real measure of profitability. Most well-run owner-operators achieve $0.15–$0.40 net per mile after all costs including owner salary; small fleets with 5–20 trucks typically see net margins of 4–8% when properly managed. The Operating Ratio (total expenses / total revenue) is the industry's standard health metric: below 90% is healthy, 90–95% is acceptable but tight, and above 95% is a warning sign that the business is close to breakeven. A pro forma makes these ratios visible month by month for three years, which is exactly what commercial lenders and equipment financing companies need to approve a loan.
Trucking Industry at a Glance
Financial templates built for trucking companies and owner-operators — pre-loaded with freight billing, fuel surcharge, and per-mile cost categories.
Revenue Drivers
- Linehaul freight rates
- Fuel surcharge revenue
- Accessorial charges
- Dedicated contract lanes
Key Cost Categories
- Driver wages & settlements
- Fuel
- Maintenance & repairs
- Insurance (liability, cargo, physical damage)
- Equipment payments & depreciation
- Permits & compliance fees
Typical Margins
Gross: 12-20% · Net: 2.5-8%
Seasonality
Peak freight volumes in August–October (back-to-school and holiday restocking) and late November–December. Slowest in January–March post-holiday.
Key Performance Indicators
Trucking Pro Forma Template FAQ
More Trucking Templates
Trucking Balance Sheet Template for Excel
$29
Trucking Budget Template for Excel
$29
Trucking Business Plan Template for Excel
$39
Trucking Cash Flow Template for Excel
$29
Trucking Expense Tracker Template for Excel
$29
Trucking Financial Model Template for Excel
$29
Trucking Income Statement Template for Excel
$29
Trucking Invoice Template for Excel
$29
Trucking KPI Dashboard Template for Excel
$29
Trucking P&L Template for Excel
$29
Trucking Project Budget Template for Excel
$29
Trucking Sales Forecast Template for Excel
$29
Trucking Company Valuation Template for Excel
$29
Trucking Pro Forma Template
$29