Manufacturing Business Plan Template
A complete business plan template for manufacturers and production facilities. Model production capacity and unit costs, forecast equipment and facility startup costs, and project EBITDA across three years.
What's Inside This Manufacturing Business Plan Template
This template includes 5 worksheets, each designed for a specific part of your manufacturing financial workflow:
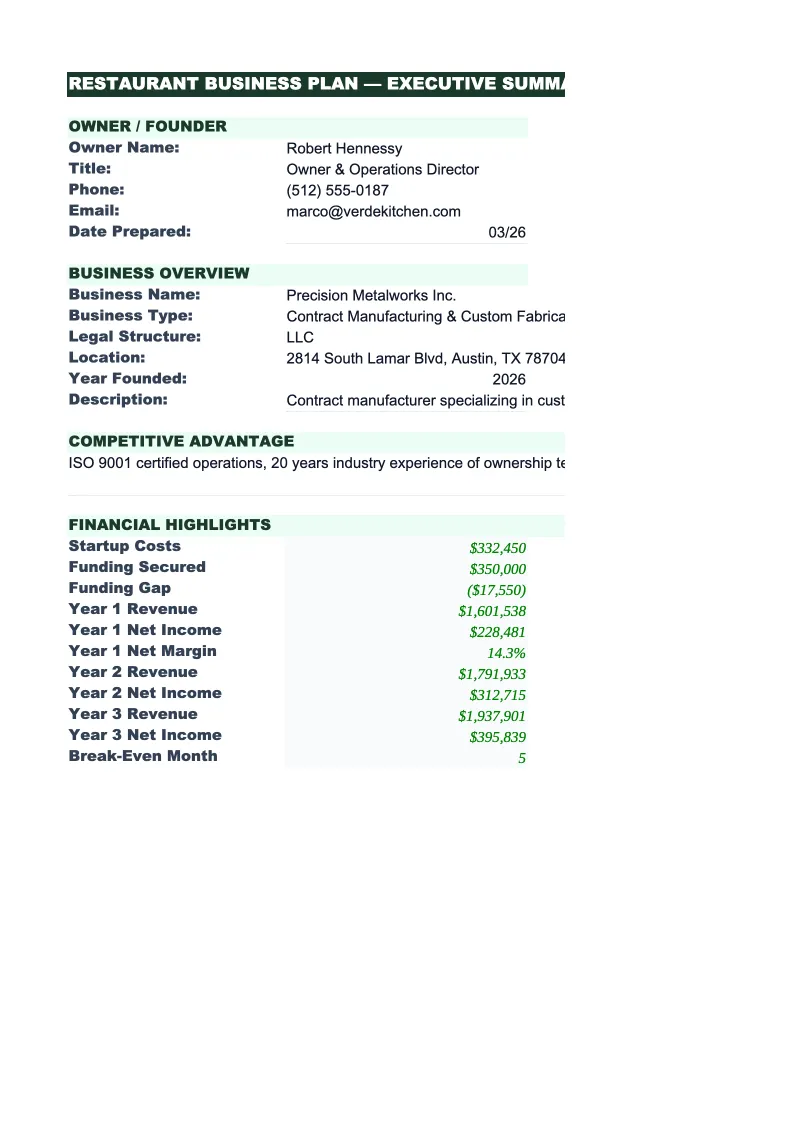
Executive Summary
The one-page snapshot of your manufacturing business, ideal for equipment lenders and manufacturing-focused investors.
Startup Costs & Funding
Breaks down the investment required to launch manufacturing operations: facility lease or purchase and buildout (production floor, quality control area, warehouse), production equipment and machinery (with purchase vs.
Revenue Forecast
A 12-month unit and revenue forecast built from production capacity and sales pipeline.
Projected P&L
Annual projections for years 1, 2, and 3 showing total revenue (units × average selling price), cost of goods sold (materials, labor, overhead allocated to production), gross profit and gross margin %, operating expenses (sales, marketing, administrative, distribution, customer support), and depreciation.
Dashboard
A visual summary of your manufacturing operation's efficiency and profitability.
Manufacturing Business Plan Template Features
- Unit-based revenue model built from production capacity, sales pipeline, and average selling price
- Production ramp-up schedule with capacity constraints and bottleneck identification
- Cost of goods sold (COGS) tracking with materials, direct labor, and allocated overhead per unit
- Startup costs with equipment purchase vs. lease analysis and working capital requirements
- 3-year P&L showing gross margin %, unit contribution margin, and break-even volume
- Dashboard with capacity utilization, cost per unit, cash conversion cycle, and profitability trajectory
How to Use This Manufacturing Business Plan Spreadsheet
Start with the Executive Summary. Define your product, target market, and production capacity (units per month at full capacity). Calculate your average selling price per unit and target cost of goods sold per unit (typically 40–60% of selling price depending on your industry). This gives you your target gross margin per unit, which drives everything else. Then move to the Startup Costs & Funding sheet. Estimate equipment costs from manufacturer quotes, facility lease or purchase costs, initial tooling (if applicable), and working capital to fund inventory and accounts receivable during ramp-up.
Next, go to the Revenue Forecast sheet. Enter your sales pipeline—how many units can you realistically sell per month during months 1–12? Most new manufacturers operate at 40–60% of installed capacity in year one due to limited sales and distribution. Build a ramp-up schedule that reflects your customer acquisition timeline and production constraints. If you have long lead times for raw materials or production batches, account for that in your monthly production plan. Calculate your inventory requirement (number of months of production you hold in inventory) and add that to your working capital need.
From production plan to lender-ready business plan in under an hour
Enter your unit production capacity, selling price, cost per unit, and equipment needs. The template builds your 3-year projections, break-even volume, and working capital requirements automatically.
Why Manufacturers Need a Solid Business Plan
A manufacturing business plan is scrutinized heavily by equipment lenders and SBA lenders because manufacturing is capital-intensive and cash-flow dependent. Lenders want to see: realistic unit economics (cost per unit and gross margin per unit), a credible sales pipeline (purchase orders or letters of intent from customers), a detailed production ramp-up schedule, and sufficient working capital to fund inventory and accounts receivable through the ramp-up phase. A plan that assumes immediate full capacity utilization and doesn't account for the time it takes to build distribution will be rejected. Manufacturing startups fail more often from cash flow problems than from operational issues—you need enough working capital to survive the ramp.
The three metrics that define manufacturing financial health are gross margin per unit (selling price minus COGS per unit), capacity utilization rate (actual production divided by maximum capacity), and cash conversion cycle (how many days of cash you have tied up in inventory and accounts receivable). A manufacturer with $20 gross margin per unit, 80% capacity utilization, and 45-day cash conversion cycle can hit 25% EBITDA at maturity. A manufacturer with $8 gross margin per unit, 60% capacity utilization, and 75-day cash conversion cycle is barely profitable and vulnerable to market downturns. Unit economics—your profit per unit—must be strong enough to cover overhead and still leave room for profit.
Manufacturing Industry at a Glance
Financial templates built for manufacturers — from job shops and contract fabricators to production facilities. Pre-loaded with cost categories, billing structures, and KPIs specific to how manufacturers track materials, labor, and overhead.
Revenue Drivers
- Product sales
- Contract/job shop work
- Tooling and setup fees
- NRE charges
- Material markups
- Aftermarket parts and service
Key Cost Categories
- Raw materials / direct materials
- Direct labor
- Manufacturing overhead
- Outside processing / subcontracting
- Equipment depreciation
- SG&A
Typical Margins
Gross: 20-35% · Net: 4-10%
Seasonality
Q1 weakest across most segments. Q3/Q4 strongest for consumer goods and construction materials manufacturers. Automotive suppliers follow OEM model-year shutdowns. Industrial equipment sees Q4 budget-spend surge.
Key Performance Indicators
Manufacturing Business Plan Template FAQ
More Manufacturing Templates
Manufacturing Balance Sheet Template for Excel
$29
Manufacturing Budget Template for Excel
$29
Manufacturing Cash Flow Template for Excel
$29
Manufacturing Expense Tracker Template for Excel
$29
Manufacturing Financial Model Template for Excel
$29
Manufacturing Income Statement Template for Excel
$29
Manufacturing Invoice Template for Excel
$29
Manufacturing KPI Dashboard Template for Excel
$29
Manufacturing P&L Template for Excel
$29
Manufacturing Pro Forma Template for Excel
$29
Manufacturing Project Budget Template for Excel
$29
Manufacturing Sales Forecast Template for Excel
$29
Manufacturing Business Valuation Template for Excel
$29
More Business Plan Templates
Manufacturing Business Plan Template
$39