Manufacturing Valuation Template
Value your manufacturing business using EBITDA multiples, asset-based valuation, and DCF — with benchmarks calibrated to current industrial M&A markets.
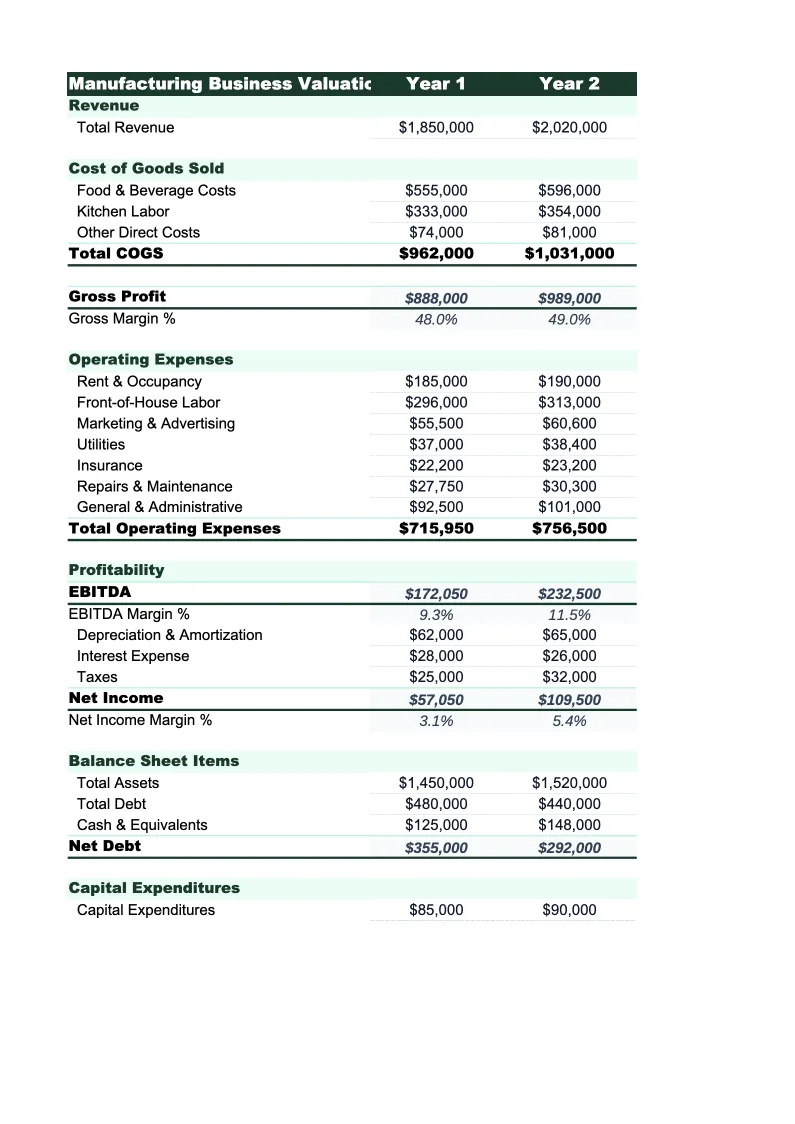
What's Inside This Manufacturing Valuation Template
This template includes 6 worksheets, each designed for a specific part of your manufacturing financial workflow:
Business Inputs
The foundation of your entire valuation.
EBITDA Multiple Approach
The primary valuation method for manufacturing businesses.
Asset-Based Valuation
Manufacturing is capital-intensive, and the asset floor matters more than in service businesses.
DCF Model
A five-year discounted cash flow model built around manufacturing revenue and cost structure.
Value Drivers Scorecard
A qualitative assessment of the factors that move your EBITDA multiple up or down within its range.
Valuation Summary
A single-page output pulling results from each valuation method into one view.
Manufacturing Valuation Template Features
- Adjusted EBITDA calculation with owner comp, one-time, and personal expense add-backs
- EBITDA multiple matrix segmented by manufacturer type: job shop, specialty, OEM supplier
- Asset-based valuation with equipment fair market value and inventory adjustments
- Value drivers scorecard covering customer concentration, backlog, and management depth
- 5-year DCF model with WACC inputs calibrated for privately held industrial businesses
- Three-scenario summary with sensitivity table for EBITDA multiple negotiation range
How to Use This Manufacturing Valuation Spreadsheet
Start with the Business Inputs sheet. Gather your trailing twelve-month income statement and balance sheet before you open the template. You'll need revenue, gross profit, and EBITDA (or the components to calculate it); owner's compensation broken out; a list of major assets with their estimated fair market values; and your top 5 customer names and their share of revenue. This data entry takes 30–45 minutes if you're pulling from QuickBooks or your accountant's year-end financials. Don't estimate — get the actual numbers, because a $50K difference in EBITDA can shift a valuation by $300–400K at a 6x multiple.
Work through the EBITDA Multiple Approach next. Review the adjusted EBITDA calculation and make sure all legitimate add-backs are captured — owner's salary above what a replacement manager would cost, personal vehicles, one-time legal or equipment expenses, and any family members on payroll who aren't actively working. Then go through the Value Drivers Scorecard and score your business honestly on each dimension. The scorecard output suggests a multiple range; most owners score themselves at the high end, so force yourself to be realistic about customer concentration and owner-dependency before locking in a number.
15 minutes from download to your manufacturing valuation
Enter your EBITDA, asset values, and customer mix — and see your manufacturing company's valuation range across three methods, with benchmarks to support every number.
How Manufacturing Businesses Are Valued
Manufacturing businesses are most commonly valued on EBITDA multiples, but the range is wide — 3x to 9x depending on what you make and how you make it. The biggest driver of where a company lands is whether it has proprietary products and IP versus purely contract or job-shop work. A contract manufacturer with no patents, one dominant customer, and thin margins might see 3–4x EBITDA. A specialty fabricator with five years of supply agreements across a dozen customers, 20%+ EBITDA margins, and defensible niche expertise can command 7–8x. Understanding where your business sits on that spectrum is the starting point for any credible valuation.
The asset base matters more in manufacturing than in most industries. Buyers pay attention to equipment age and replacement value, real estate ownership versus lease, and working capital levels — particularly inventory. A manufacturer carrying six months of raw materials because of long lead times looks different on a cash basis than one with 45-day inventory turns. Customer concentration is the other major variable: any single customer above 20–25% of revenue is a discount factor, because that concentration risk transfers directly to the buyer. Buyers may escrow a portion of the purchase price contingent on that customer staying post-close, effectively reducing the upfront proceeds.
Manufacturing Industry at a Glance
Financial templates built for manufacturers — from job shops and contract fabricators to production facilities. Pre-loaded with cost categories, billing structures, and KPIs specific to how manufacturers track materials, labor, and overhead.
Revenue Drivers
- Product sales
- Contract/job shop work
- Tooling and setup fees
- NRE charges
- Material markups
- Aftermarket parts and service
Key Cost Categories
- Raw materials / direct materials
- Direct labor
- Manufacturing overhead
- Outside processing / subcontracting
- Equipment depreciation
- SG&A
Typical Margins
Gross: 20-35% · Net: 4-10%
Seasonality
Q1 weakest across most segments. Q3/Q4 strongest for consumer goods and construction materials manufacturers. Automotive suppliers follow OEM model-year shutdowns. Industrial equipment sees Q4 budget-spend surge.
Key Performance Indicators
Manufacturing Business Valuation FAQ
More Manufacturing Templates
Manufacturing Balance Sheet Template for Excel
$29
Manufacturing Budget Template for Excel
$29
Manufacturing Business Plan Template for Excel
$39
Manufacturing Cash Flow Template for Excel
$29
Manufacturing Expense Tracker Template for Excel
$29
Manufacturing Financial Model Template for Excel
$29
Manufacturing Income Statement Template for Excel
$29
Manufacturing Invoice Template for Excel
$29
Manufacturing KPI Dashboard Template for Excel
$29
Manufacturing P&L Template for Excel
$29
Manufacturing Pro Forma Template for Excel
$29
Manufacturing Project Budget Template for Excel
$29
Manufacturing Sales Forecast Template for Excel
$29
Manufacturing Valuation Template
$29