Manufacturing Pro Forma Template
Project a manufacturing company's revenue, cost of goods, overhead, and net income across 5 years — with pre-built formulas for capacity utilization, unit economics, standard costing, and break-even analysis.
What's Inside This Manufacturing Pro Forma Template
This template includes 7 worksheets, each designed for a specific part of your manufacturing financial workflow:
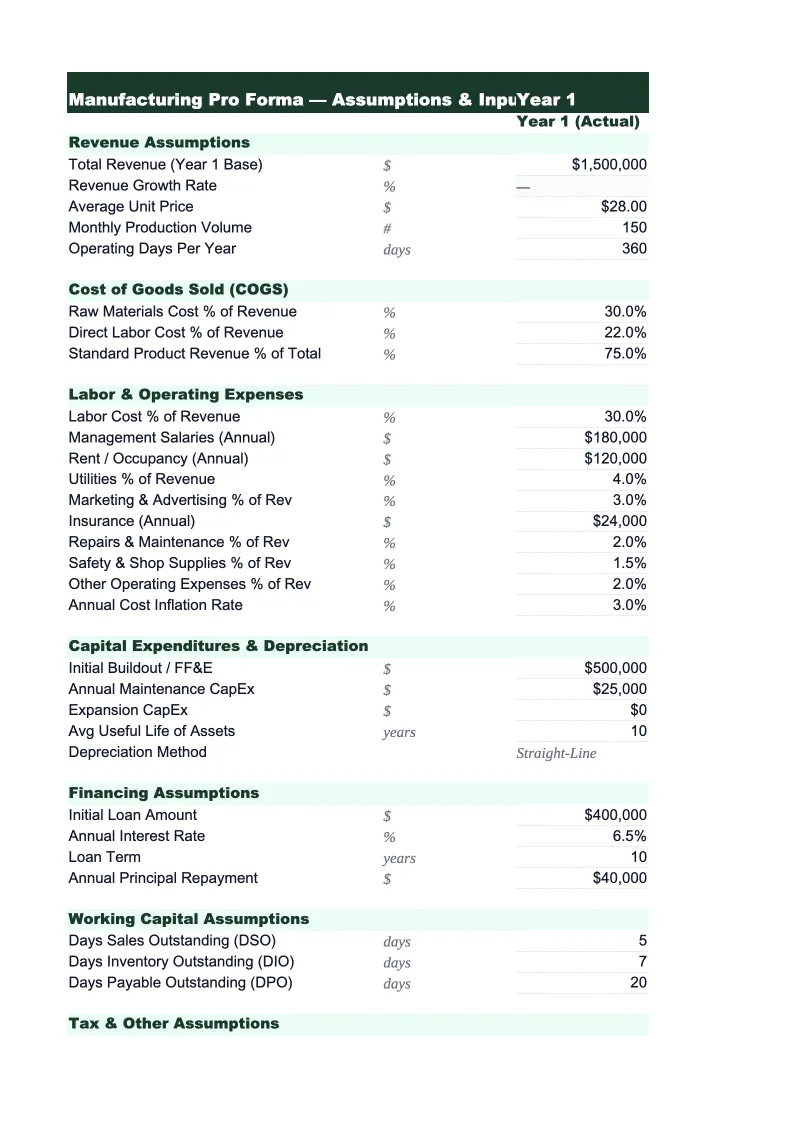
Assumptions
The control panel for the entire model.
Revenue Projections
Projects total manufacturing revenue by month for year one and annually through year five.
Cost of Goods Sold
Breaks manufacturing costs into the four components that determine gross margin: raw materials and direct materials (entered as a percentage of revenue or a per-unit cost), direct labor (hours per unit times wage rate, plus burden for payroll taxes and benefits), manufacturing overhead (indirect labor, utilities, machine maintenance, depreciation, tooling, and quality control), and outside processing and subcontracting costs for operations performed off-site.
Overhead & SG&A
Covers all costs above the gross profit line that are not directly allocated to production: plant management and operations staff salaries, sales and estimating, finance and accounting, engineering and quality salaries, building rent or mortgage (for the portion not allocated to manufacturing overhead), corporate insurance, software and ERP subscriptions, vehicle fleet, travel, and marketing.
5-Year P&L Summary
An annual summary showing total revenue, direct materials, direct labor, manufacturing overhead, gross profit, gross margin percentage, SG&A, EBITDA, depreciation and amortization, interest expense, and net income side by side for each of the five projected years.
Cash Flow Projection
A monthly cash flow model for year one and an annual summary through year five, built for the specific cash dynamics of manufacturing operations.
Break-Even Analysis
Calculates the annual revenue and production volume a manufacturing company needs to cover all fixed and variable costs.
Manufacturing Pro Forma Template Features
- Revenue model by product line and job type with unit volume and ASP inputs — not a single top-line estimate
- COGS breakdown by direct materials, direct labor, manufacturing overhead, and outside processing with standard cost variance tracking
- Overhead model separating fixed and variable costs with SG&A-as-percent-of-revenue calculation by year
- Monthly cash flow with inventory build, AR timing, and capex planning including depreciation schedules
- 5-year annual P&L summary with gross margin, EBITDA, and net margin by year
- Break-even analysis by revenue and capacity utilization across gross margin scenarios
How to Use This Manufacturing Pro Forma Spreadsheet
Start with the Assumptions sheet. Enter your product line or job category breakdown, the average selling price for each category, and your direct material cost as a percentage of revenue. If you're a job shop, this might be three categories — standard machined parts, custom fabrication, and tooling/fixtures. If you're a production manufacturer, it might be your top SKU families. Set your planned capacity utilization for year one — most manufacturing businesses don't start at full capacity, and the ramp schedule lets you model realistic output growth without assuming 100% throughput from day one. Get these inputs right before moving to any other sheet, because every downstream calculation flows from here.
Once assumptions are in place, review the Cost of Goods Sold sheet and verify the cost percentages match your actual production economics. Direct materials as a percent of revenue is the most important input — it varies from 20% for highly labor-intensive custom work to 60%+ for manufacturers who buy expensive raw stock and do light conversion. Direct labor hours per unit and the wage rate plus burden will drive your labor cost calculation. If you have historical job cost data, use it to calibrate these numbers; if you're projecting a new product or line, use industry benchmarks as your starting point and build in a 5–10% buffer for startup inefficiency. Then populate the Overhead & SG&A sheet with your actual or planned fixed cost base.
From download to lender-ready projections in under an hour
Enter your product mix, unit economics, and cost structure — the model builds your 5-year revenue, gross margin, overhead, and cash flow analysis automatically.
Why Every Manufacturer Needs a Pro Forma
Manufacturing is capital-intensive, inventory-heavy, and slow to scale — which is exactly why pro forma financial projections matter more here than in most industries. Equipment takes months to procure and qualify. Suppliers need lead time before they can ramp supply. New product lines require tooling investment before the first unit ships. A manufacturer who projects revenue without modeling the capital expenditures, inventory build, and working capital required to support that revenue will run into cash shortfalls before reaching the growth targets they projected. The pro forma isn't just for showing investors a number — it's for stress-testing whether the growth plan is actually fundable.
The two numbers that define manufacturing financial health are gross margin and EBITDA margin. For discrete manufacturers — machined parts, fabricated assemblies, consumer goods — gross margins typically run 20–35%, with gross margin determined almost entirely by the relationship between your average selling price and your direct material plus direct labor cost. Net margins in manufacturing are tight: 4–10% is normal, and many manufacturers run at 5–7% net. This means that a 2-percentage-point increase in material costs — from steel price increases, aluminum tariffs, or supply disruptions — can cut net income by 40% if you don't raise prices to match. Modeling these scenarios in a pro forma before they happen is how manufacturing operators stay solvent through commodity cycles.
Manufacturing Industry at a Glance
Financial templates built for manufacturers — from job shops and contract fabricators to production facilities. Pre-loaded with cost categories, billing structures, and KPIs specific to how manufacturers track materials, labor, and overhead.
Revenue Drivers
- Product sales
- Contract/job shop work
- Tooling and setup fees
- NRE charges
- Material markups
- Aftermarket parts and service
Key Cost Categories
- Raw materials / direct materials
- Direct labor
- Manufacturing overhead
- Outside processing / subcontracting
- Equipment depreciation
- SG&A
Typical Margins
Gross: 20-35% · Net: 4-10%
Seasonality
Q1 weakest across most segments. Q3/Q4 strongest for consumer goods and construction materials manufacturers. Automotive suppliers follow OEM model-year shutdowns. Industrial equipment sees Q4 budget-spend surge.
Key Performance Indicators
Manufacturing Pro Forma Template FAQ
More Manufacturing Templates
Manufacturing Balance Sheet Template for Excel
$29
Manufacturing Budget Template for Excel
$29
Manufacturing Business Plan Template for Excel
$39
Manufacturing Cash Flow Template for Excel
$29
Manufacturing Expense Tracker Template for Excel
$29
Manufacturing Financial Model Template for Excel
$29
Manufacturing Income Statement Template for Excel
$29
Manufacturing Invoice Template for Excel
$29
Manufacturing KPI Dashboard Template for Excel
$29
Manufacturing P&L Template for Excel
$29
Manufacturing Project Budget Template for Excel
$29
Manufacturing Sales Forecast Template for Excel
$29
Manufacturing Business Valuation Template for Excel
$29
Manufacturing Pro Forma Template
$29