Manufacturing Sales Forecast Template
Forecast manufacturing revenue by product line, order book, and quote pipeline — with capacity checks, actual vs forecast tracking, and scenario planning built in.
What's Inside This Manufacturing Sales Forecast Template
This template includes 7 worksheets, each designed for a specific part of your manufacturing financial workflow:
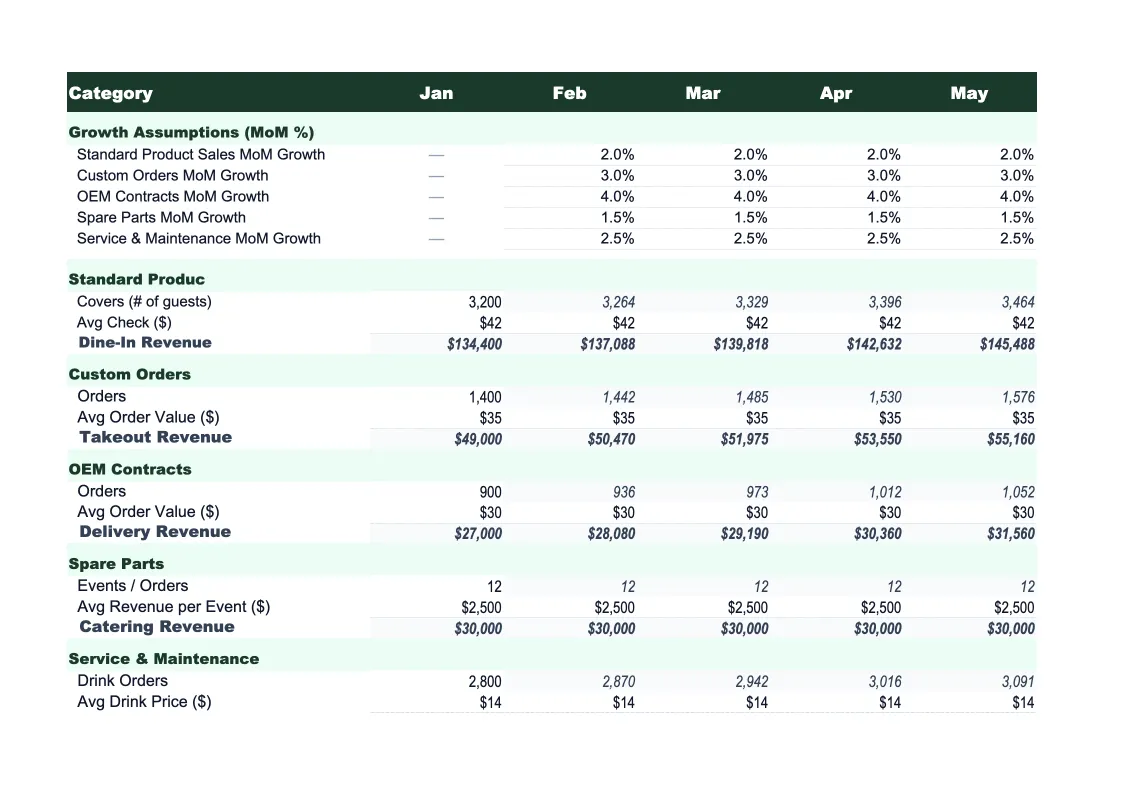
Product Line Forecast
The core planning sheet where you project revenue by product family or SKU group across a 12-month horizon.
Order Book
A schedule of all confirmed purchase orders and long-term supply agreements currently on hand.
Quote Pipeline
A weighted view of all active customer quotes and RFQ responses in play.
Monthly Summary
The consolidated 12-month revenue forecast, built from three streams: order book revenue (pulled from the Order Book sheet automatically), weighted quote pipeline revenue (from the Quote Pipeline sheet), and a line for spot orders or unforecasted business you typically pick up each month.
Actual vs Forecast
A month-by-month comparison of projected revenue against actual invoiced revenue, broken out by product line.
Scenario Comparison
Three side-by-side annual revenue scenarios — base, upside, and downside — built from different assumptions about order book stability, pipeline win rates, and demand volume per product line.
Dashboard
A visual summary of the forecast with pre-built charts: monthly revenue by product line (stacked bar), order book coverage ratio trend (how many months of order book you carry each month), actual vs forecast variance over the trailing six months (line chart), and pipeline by probability tier (a simple breakdown showing how much of your weighted pipeline is high-confidence versus speculative).
Manufacturing Sales Forecast Template Features
- Product line revenue forecast with seasonal adjustment multipliers
- Order book schedule spreading PO values across delivery months
- Weighted quote pipeline: opportunity value × close probability
- Capacity utilization check comparing forecast to production ceiling
- Three-scenario comparison with adjustable win rates and volume assumptions
- Actual vs forecast variance tracker with rolling accuracy score
How to Use This Manufacturing Sales Forecast Spreadsheet
Begin with the two sheets that contain your firmest data: the Order Book and the Product Line Forecast. In the Order Book, enter every confirmed purchase order and supply agreement you're currently holding — customer name, product, order value, and expected ship months. This is the foundation of your forecast, and it takes priority over everything else because it's already committed revenue. Then move to the Product Line Forecast and enter your expected unit volumes and prices for each product family. If you produce both standard catalog items and custom/contract work, keep them as separate rows — they behave differently seasonally and have different gross margins, so blending them masks useful information. Budget 45–60 minutes for the initial setup if you have more than a dozen active customers.
Once the order book and product line estimates are in, populate the Quote Pipeline with your active RFQs and customer proposals. Be honest about close probabilities — the most common forecasting error in manufacturing is treating a submitted quote as a near-certain win before the customer has given any signal. A useful discipline: assign probabilities based on defined criteria (shortlisted, verbal award, under negotiation) rather than gut feel for each deal. Then review the Monthly Summary sheet to check that the combined picture makes sense. Pay specific attention to the capacity utilization row at the bottom — if a month shows revenue projections that would require running at 110% of capacity, either the forecast is wrong or you need to plan for overtime and subcontracting now rather than scrambling in that month.
15 minutes from download to your first revenue forecast
Download the template, enter your order book and active quotes, and see your manufacturing company's projected revenue — by product line, month by month.
Why Every Manufacturer Needs a Sales Forecast Template
Manufacturing revenue is hard to forecast accurately because it combines two fundamentally different demand signals: the order book, which is relatively predictable because it's already under contract, and the quote pipeline, which converts at a rate that varies by market conditions, product type, and competitive dynamics. A job shop or contract manufacturer might have 90 days of firm orders in hand and then face a cliff — revenue depends entirely on how many of the open quotes close in the next quarter. A standard products manufacturer might have stable repeating demand from distributors but unpredictable large orders from OEM customers. Most manufacturers try to build a single revenue forecast without clearly separating these two signals, which produces a number that's simultaneously too optimistic on the pipeline side and insufficiently detailed on the order book side.
The two ratios that matter most in manufacturing revenue forecasting are order book coverage and pipeline close rate. Order book coverage is your total firm orders on hand divided by your monthly revenue run rate — healthy manufacturers typically carry two to four months of order book coverage, though this varies significantly by industry segment. Below one month of coverage means you're heavily dependent on pipeline conversions to fund next month's production, which creates cash flow and scheduling risk simultaneously. Pipeline close rate is what percentage of your weighted quote pipeline actually converts to POs over a 90-day period — if you're weighting opportunities at 50% but historically winning 30%, your forecast is systematically overstating revenue. Tracking both metrics monthly, which this template calculates automatically, is what gives you enough lead time to respond to demand shortfalls before they hit production.
Manufacturing Industry at a Glance
Financial templates built for manufacturers — from job shops and contract fabricators to production facilities. Pre-loaded with cost categories, billing structures, and KPIs specific to how manufacturers track materials, labor, and overhead.
Revenue Drivers
- Product sales
- Contract/job shop work
- Tooling and setup fees
- NRE charges
- Material markups
- Aftermarket parts and service
Key Cost Categories
- Raw materials / direct materials
- Direct labor
- Manufacturing overhead
- Outside processing / subcontracting
- Equipment depreciation
- SG&A
Typical Margins
Gross: 20-35% · Net: 4-10%
Seasonality
Q1 weakest across most segments. Q3/Q4 strongest for consumer goods and construction materials manufacturers. Automotive suppliers follow OEM model-year shutdowns. Industrial equipment sees Q4 budget-spend surge.
Key Performance Indicators
Manufacturing Sales Forecast Template FAQ
More Manufacturing Templates
Manufacturing Balance Sheet Template for Excel
$29
Manufacturing Budget Template for Excel
$29
Manufacturing Business Plan Template for Excel
$39
Manufacturing Cash Flow Template for Excel
$29
Manufacturing Expense Tracker Template for Excel
$29
Manufacturing Financial Model Template for Excel
$29
Manufacturing Income Statement Template for Excel
$29
Manufacturing Invoice Template for Excel
$29
Manufacturing KPI Dashboard Template for Excel
$29
Manufacturing P&L Template for Excel
$29
Manufacturing Pro Forma Template for Excel
$29
Manufacturing Project Budget Template for Excel
$29
Manufacturing Business Valuation Template for Excel
$29
More Sales Forecast Templates
Manufacturing Sales Forecast Template
$29