Restaurant Business Plan Template
A complete business plan template for restaurants and food service concepts. Project revenue from covers and average check, model startup costs and funding needs, and forecast EBITDA across three years.
What's Inside This Restaurant Business Plan Template
This template includes 5 worksheets, each designed for a specific part of your restaurant financial workflow:
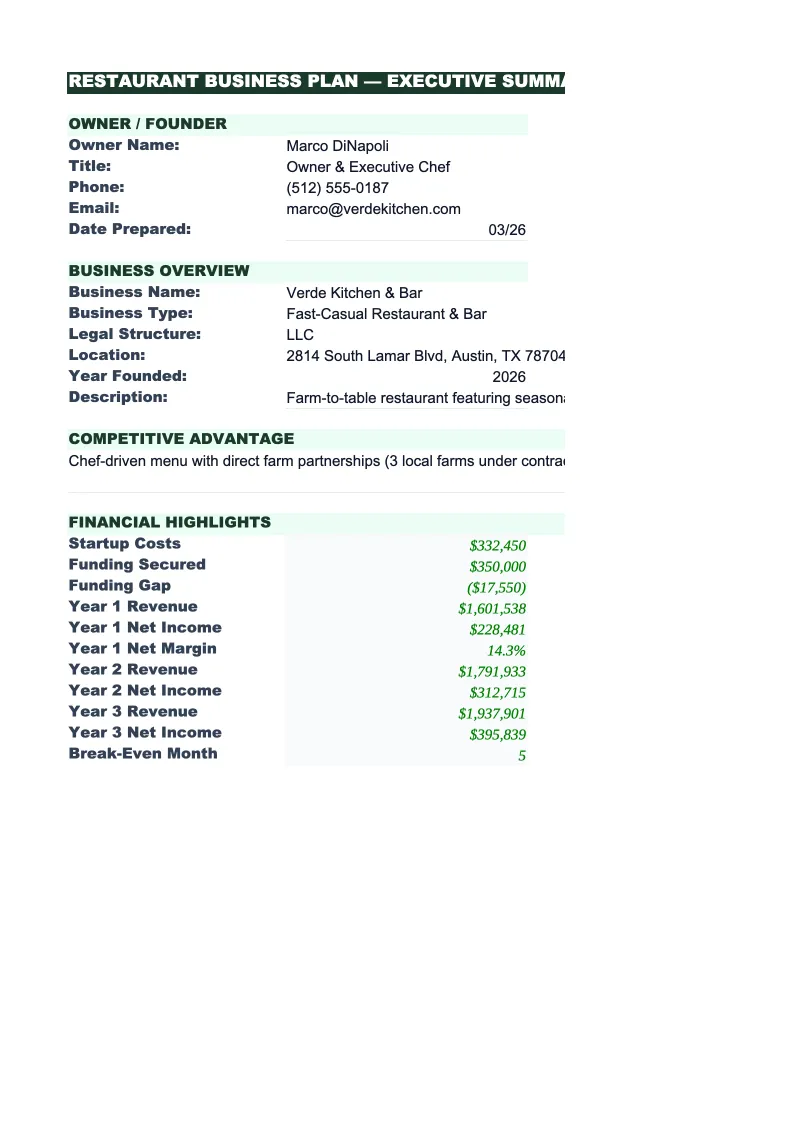
Executive Summary
The one-page snapshot of your restaurant concept, ideal for lenders and investors.
Startup Costs & Funding
Breaks down the total investment required to open your restaurant in these categories: leasehold improvements and buildout, kitchen equipment, POS and technology, furniture and fixtures, licenses and permits, pre-opening labor and training, initial inventory, and working capital.
Revenue Forecast
A 12-month month-by-month forecast of restaurant revenue broken by stream: dine-in food, dine-in beverage, takeout, and delivery.
Projected P&L
Annual projections for years 1, 2, and 3 showing revenue, cost of goods sold (food and beverage cost separately), gross profit, labor (FOH, BOH, management), occupancy (rent, CAM, insurance), and operating expenses (utilities, marketing, supplies, POS fees).
Dashboard
A visual summary of your restaurant's financial health.
Restaurant Business Plan Template Features
- Cover count model with ramp-up schedule built from seating capacity, turns per day, and target covers
- Revenue forecast by stream (dine-in food, beverage, takeout, delivery) with seasonality adjustments
- Startup costs tracker with buildout, equipment, technology, and working capital—feeds into cash needs
- 3-year P&L with COGS split by food and beverage, labor segmented by FOH/BOH/management
- Break-even analysis showing daily covers and monthly revenue needed to cover all fixed and variable costs
- Dashboard with unit economics, payback period, ROI, and visual charts of revenue and margin progression
How to Use This Restaurant Business Plan Spreadsheet
Start with the Executive Summary. Write a 2–3 sentence description of your concept (format, cuisine, price point, location), then move to the Startup Costs & Funding sheet. Fill in your buildout budget from landlord estimates, equipment costs from supplier quotes, and working capital needs. The template will calculate your total funding requirement and show you exactly how much equity and debt you'll need to raise.
Next, go to the Revenue Forecast sheet. Enter your seating capacity, target turns per day, and average check size by revenue stream (food vs. beverage). The model automatically calculates covers per day and applies your ramp-up schedule: most new restaurants operate at 50–70% of target covers in months 1–6 as the team scales and word-of-mouth builds. Adjust the ramp percentages to match your conservative estimate of how fast you'll build. This is the most critical input—get it right and your working capital forecast will be realistic.
From concept to lender-ready business plan in under an hour
Enter your seating, covers, average check, and startup costs. The template builds your executive summary, 3-year financial projections, and break-even analysis automatically.
Why Restaurants Need a Solid Business Plan
A restaurant business plan is the difference between a concept that works and one that fails in the first year. For SBA lenders, a business plan that shows realistic assumptions—a plausible ramp schedule, food cost and labor percentages in line with your concept type, and a path to debt service coverage—will get funded. For equity investors and partners, it demonstrates you understand your unit economics: what revenue per cover you need, how much net income you'll generate at maturity, and what their return on capital will be. A plan that assumes full revenue from day one and 12% net margins loses credibility with both audiences.
The three financial metrics that determine whether a restaurant survives are food cost percentage (28–35% for full-service, 25–30% for fast-casual), total labor cost percentage (28–35% of revenue), and occupancy cost percentage (ideally 8–10% of revenue, but often higher in expensive urban markets). A restaurant with 32% food cost, 32% labor, and 12% occupancy cost can still hit 15% EBITDA at maturity. A restaurant with 38% food cost, 36% labor, and 12% occupancy is structurally unprofitable—and a business plan is where you should discover that, not six months after opening.
Restaurant Industry at a Glance
Financial templates built for restaurants — from fast-casual to fine dining. Pre-loaded with food cost categories, labor splits, and industry-standard KPIs.
Revenue Drivers
- Dine-in sales
- Takeout & delivery
- Catering
- Alcohol sales
Key Cost Categories
- Food costs (COGS)
- Labor
- Rent & occupancy
- Utilities
- Marketing
- Equipment & maintenance
Typical Margins
Gross: 60-70% · Net: 3-9%
Seasonality
Higher revenue in summer and holiday seasons; January-February typically slowest months.
Key Performance Indicators
Restaurant Business Plan Template FAQ
More Restaurant Templates
Restaurant Balance Sheet Template for Excel
$29
Restaurant Budget Template for Excel
$29
Restaurant Cash Flow Template for Excel
$29
Restaurant Expense Tracker Template for Excel
$29
Restaurant Financial Model Template for Excel
$29
Restaurant Income Statement Template for Excel
$29
Restaurant Invoice Template for Excel
$29
Restaurant KPI Dashboard Template for Excel
$29
Restaurant P&L Template for Excel
$29
Restaurant Pro Forma Template for Excel
$29
Restaurant Project Budget Template for Excel
$29
Restaurant Sales Forecast Template for Excel
$29
Restaurant Valuation Template for Excel
$29
More Business Plan Templates
Restaurant Business Plan Template
$39