Restaurant Financial Model Template
Project revenue by covers and average check, model your prime cost, and see your cash position month by month — built specifically for restaurant operators and new restaurant owners.
What's Inside This Restaurant Financial Model Template
This template includes 7 worksheets, each designed for a specific part of your restaurant financial workflow:
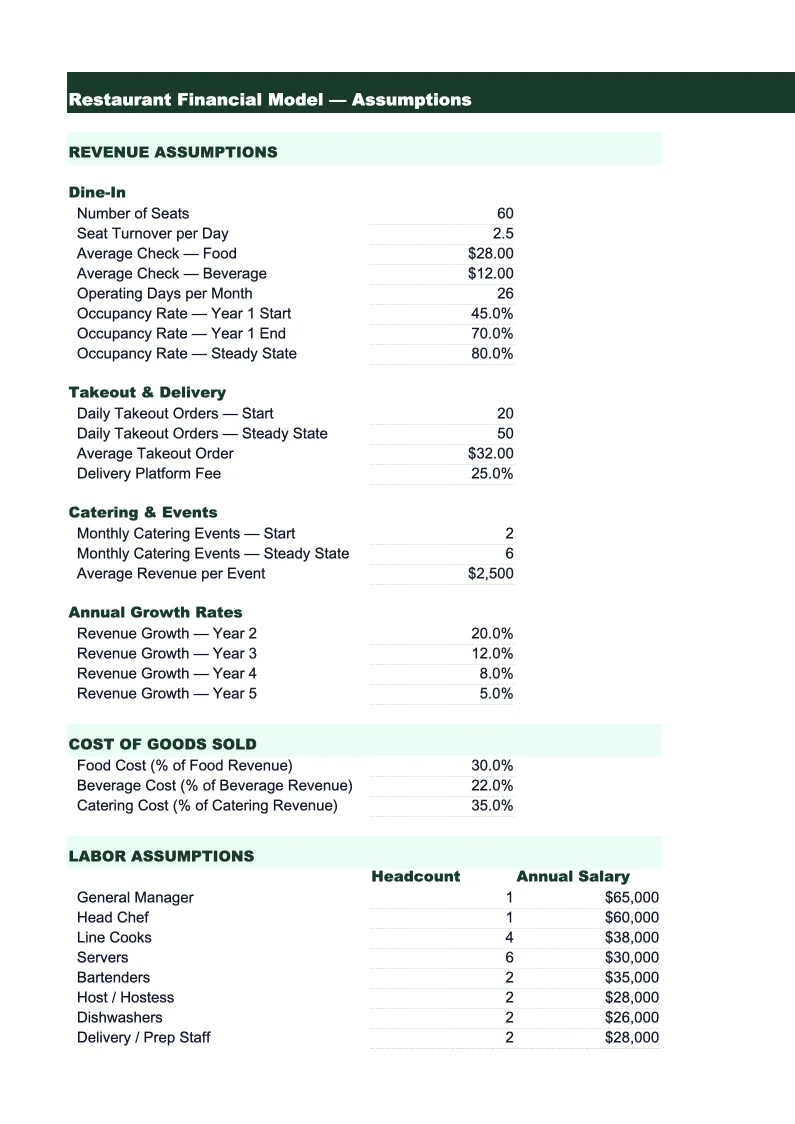
Assumptions
The control center for the entire model.
Revenue Projections
A 24-month revenue build driven by your covers and average check assumptions.
Food & Beverage Cost
A detailed cost of goods model that tracks food cost and beverage cost separately, broken down by category.
Labor Plan
A month-by-month labor model split by role category: front-of-house (servers, hosts, bussers, bartenders), back-of-house (line cooks, prep cooks, dishwashers, kitchen supervisor), and management (GM, AGM, chef).
P&L
A 24-month profit and loss statement that pulls revenue from the Revenue Projections sheet, COGS from the Food & Beverage Cost sheet, and labor from the Labor Plan.
Cash Flow
A monthly cash flow statement that shows opening cash, cash in from operations, and cash out for expenses, capital expenditures, and debt service.
Dashboard
A one-page visual summary designed for use in investor presentations, bank loan applications, or internal owner reviews.
Restaurant Financial Model Template Features
- Cover-based revenue model with separate dine-in, takeout, and catering projections
- Prime cost tracker: food and labor combined as a percentage of revenue
- Food and beverage cost split by category (proteins, produce, dairy, beer, wine, spirits)
- Labor plan by role type: FOH, BOH, and management with payroll tax calculations
- Pre-opening cost schedule for new restaurant launches with break-even projection
- USAR-format P&L structure expected by investors, accountants, and SBA lenders
How to Use This Restaurant Financial Model Spreadsheet
Start with the Assumptions sheet. Enter your seating capacity, estimated covers per service (lunch and dinner), and average check size for each daypart. If you're modeling an existing restaurant, use last month's POS report for covers and average check — it takes about 10 minutes to pull those numbers. If you're projecting for a new opening, research comparable restaurants in your market and make conservative estimates. Everything else in the model calculates from what you enter here, so spend the most time getting your cover count and average check right.
Once assumptions are set, review the Revenue Projections and P&L sheets to see if the numbers look realistic. Check your food cost percentage and labor cost percentage in the Food & Beverage Cost and Labor Plan sheets — if food cost is above 35% or prime cost (food + labor) is above 65%, that's a signal to revisit your pricing, portioning, or staffing plan, not just the spreadsheet. The Cash Flow sheet shows your break-even month and monthly cash position, which is the number lenders focus on when you're seeking financing.
15 minutes from download to your first restaurant projection
Download the template, plug in your covers and average check, and see your restaurant's full financial picture — revenue, prime cost, cash flow, and break-even month included.
Why Every Restaurant Needs a Financial Model
Restaurants fail more often from cash flow problems than from bad food. The challenge is that the business collects revenue in small daily increments — $5 here, $45 there — while expenses come in large periodic hits: a $12,000 rent check on the first of the month, a $8,000 food invoice twice a week, a $22,000 payroll run every two weeks. Without a financial model that maps those cash flows month by month, it's easy to run a profitable restaurant that still runs out of cash. That's the first thing a restaurant financial model solves: showing you the shape of your cash position, not just your profitability.
The second thing it solves is prime cost discipline. Prime cost — food plus labor as a percentage of revenue — is the single number restaurant operators use to gauge whether the business is healthy. For full-service restaurants, the target is below 60–65% of revenue. For fast casual, below 55%. When prime cost creeps up, the problem is almost always in one of two places: food cost percentage drifting because of portioning drift, theft, or supplier price increases, or labor cost climbing because of inefficient scheduling, overtime, or turnover replacing trained staff with new hires. A model that tracks both separately, by category, lets you identify which is causing the problem before it compounds.
Restaurant Industry at a Glance
Financial templates built for restaurants — from fast-casual to fine dining. Pre-loaded with food cost categories, labor splits, and industry-standard KPIs.
Revenue Drivers
- Dine-in sales
- Takeout & delivery
- Catering
- Alcohol sales
Key Cost Categories
- Food costs (COGS)
- Labor
- Rent & occupancy
- Utilities
- Marketing
- Equipment & maintenance
Typical Margins
Gross: 60-70% · Net: 3-9%
Seasonality
Higher revenue in summer and holiday seasons; January-February typically slowest months.
Key Performance Indicators
Restaurant Financial Model Template FAQ
More Restaurant Templates
Restaurant Balance Sheet Template for Excel
$29
Restaurant Budget Template for Excel
$29
Restaurant Business Plan Template for Excel
$39
Restaurant Cash Flow Template for Excel
$29
Restaurant Expense Tracker Template for Excel
$29
Restaurant Income Statement Template for Excel
$29
Restaurant Invoice Template for Excel
$29
Restaurant KPI Dashboard Template for Excel
$29
Restaurant P&L Template for Excel
$29
Restaurant Pro Forma Template for Excel
$29
Restaurant Project Budget Template for Excel
$29
Restaurant Sales Forecast Template for Excel
$29
Restaurant Valuation Template for Excel
$29
More Financial Model Templates
Restaurant Financial Model Template
$29