Daycare Sales Forecast Template
Project your daycare's tuition revenue, enrollment capacity, and subsidy income by age group — with monthly breakdowns, seasonal enrollment adjustments, and actual vs forecast tracking built in.
What's Inside This Daycare Sales Forecast Template
This template includes 6 worksheets, each designed for a specific part of your daycare financial workflow:
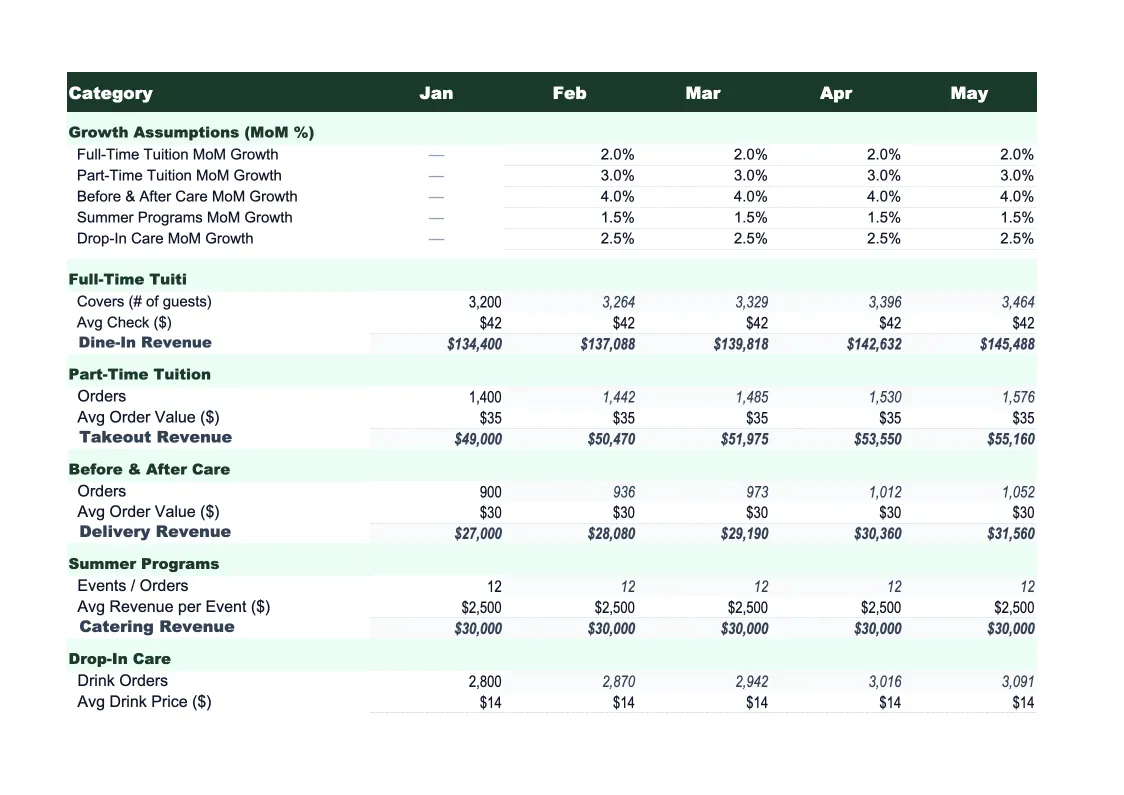
Assumptions
The driver sheet that powers all projections.
Monthly Forecast
Twelve months of projected revenue broken out by age group and revenue type.
Annual Summary
A full-year revenue rollup that shows total projected income by category — infant tuition, toddler tuition, preschool tuition, pre-K tuition, school-age care, subsidy reimbursements, enrichment fees, and registration fees — across all 12 months plus an annual total.
Actual vs Forecast
After each month, enter your actual enrollment counts and revenue collected by category alongside the forecast figures.
Scenario Comparison
Three side-by-side annual revenue scenarios — base case, upside, and downside — each calculated from different enrollment and rate assumptions.
Dashboard
A visual summary of your forecast with pre-built charts: monthly projected revenue by category (stacked bar), enrollment by age group over the year (line chart), actual vs forecast trend, and revenue mix by program type (pie chart).
Daycare Sales Forecast Template Features
- Driver-based model: enrollment capacity × occupancy % × tuition rate by age group
- Revenue split by age group (infant, toddler, preschool, pre-K, school-age)
- Subsidy and private pay tracked separately with different rate structures
- Seasonal enrollment adjustment factors for summer dips and back-to-school surges
- Actual vs forecast tracker with enrollment accuracy score
- Three-scenario comparison (base, upside, downside) for expansion planning
How to Use This Daycare Sales Forecast Spreadsheet
Start with the Assumptions sheet. Enter your licensed capacity for each age group, your current tuition rates for full-time and part-time slots, your subsidy reimbursement rate, and your current occupancy percentage by age group. Infant rooms typically run at 90%+ occupancy because demand outstrips supply; preschool rooms may run lower during summer. If you have 12 months of enrollment history, use your actual monthly enrollment as the starting occupancy rates — this takes about 20-30 minutes and gives you a baseline grounded in reality rather than wishful thinking.
With your base assumptions set, review the Monthly Forecast sheet to check whether the projections look right for each month. Apply seasonal adjustment factors where you know enrollment shifts — August and September see enrollment surges as families get on schedules before school starts, while June and July often see school-age enrollment drop. If you're planning to add capacity mid-year (opening a new room, hiring to accommodate a waitlist), set the capacity increase in the Assumptions sheet with the month it takes effect. The Scenario Comparison sheet is worth filling out next: set a conservative downside at 10-15% lower occupancy to understand your revenue floor before committing to expenses.
15 minutes from download to your first enrollment forecast
Download the template, plug in your capacity and tuition rates, and see your daycare's projected revenue — month by month, age group by age group.
Why Every Daycare Needs a Sales Forecast Template
Daycare revenue forecasting is simpler than most operators think, but it requires building from the right drivers. Total tuition revenue is enrollment × tuition rate, repeated across each age group — because infant rates can be 50-70% higher than preschool rates due to required staff-to-child ratios, mixing age groups into a single revenue number hides the real economics. A center with 12 infants at $400/week and 20 preschoolers at $250/week generates very different revenue per dollar of labor than one with 8 infants and 28 preschoolers. A driver-based forecast makes those differences visible.
The two most important forecast variables for a daycare are occupancy rate by age group and the private pay vs subsidy split. Occupancy should target 85-95% for a financially stable center — below 80% and you're likely covering fixed costs with little margin. The subsidy split matters because government subsidy reimbursement rates are typically 10-30% lower than private tuition rates and involve a payment lag; centers that budget assuming private-pay rates on all enrolled children consistently underestimate cash flow needs. A well-built daycare forecast separates these streams and models them at their actual rates rather than blending them together.
Daycare Industry at a Glance
Financial templates built for daycare centers and childcare providers — pre-loaded with tuition billing categories, subsidy tracking, and the KPIs that determine whether a center is actually making money.
Revenue Drivers
- Weekly/monthly tuition by age group
- Government subsidies and voucher programs
- Before/after school care
- Drop-in and part-time care
- Enrichment classes and summer programs
Key Cost Categories
- Payroll and benefits (50-70% of revenue)
- Rent and occupancy
- Food and meals program
- Supplies and curriculum materials
- Insurance and licensing
- Utilities
- Marketing and enrollment
Typical Margins
Gross: 30-50% · Net: 10-16%
Seasonality
Peak enrollment in August-September (school year start) and January-February. Summer dip for school-age programs. Revenue is more stable than attendance because most centers bill flat tuition regardless of days attended.
Key Performance Indicators
Daycare Sales Forecast Template FAQ
More Daycare Templates
Daycare Balance Sheet Template for Excel
$29
Daycare Budget Template for Excel
$29
Daycare Business Plan Template for Excel
$39
Daycare Cash Flow Template for Excel
$29
Daycare Expense Tracker Template for Excel
$29
Daycare Financial Model Template for Excel
$29
Daycare Income Statement Template for Excel
$29
Daycare Invoice Template for Excel
$29
Daycare KPI Dashboard Template for Excel
$29
Daycare P&L Template for Excel
$29
Daycare Pro Forma Template for Excel
$29
Daycare Project Budget Template for Excel
$29
Daycare Business Valuation Template for Excel
$29
More Sales Forecast Templates
Daycare Sales Forecast Template
$29