Daycare Cash Flow Template
Track and project cash flow for your daycare center — with tuition collection timing, government subsidy reimbursement lag, bi-weekly payroll planning, and a 13-week projection built around the cash gaps that childcare operators actually face.
What's Inside This Daycare Cash Flow Template
This template includes 4 worksheets, each designed for a specific part of your daycare financial workflow:
13-Week Cash Flow
A rolling 13-week cash projection covering the most practical planning window for a childcare operation.
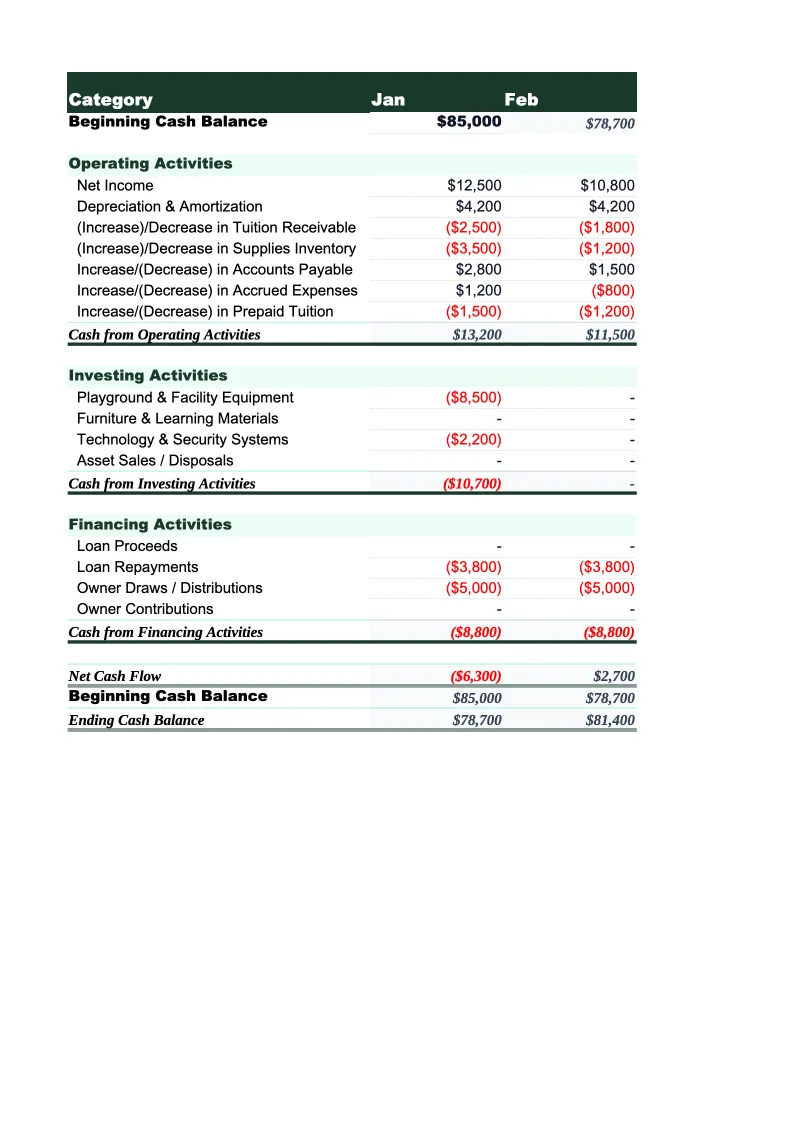
Monthly Cash Flow
A 12-month indirect-method cash flow statement organized into operating, investing, and financing activities.
Enrollment & Revenue Tracker
A dedicated sheet for tracking enrolled children by age group and billing type, which is the primary driver of both revenue and cash flow in a daycare.
Annual Summary
A full-year rollup of operating cash flow broken down by revenue source and major expense category.
Daycare Cash Flow Template Features
- 13-week cash projection with tuition split by billing cycle (weekly, monthly, drop-in) and subsidy reimbursements tracked separately from private-pay revenue
- Enrollment & Revenue Tracker organized by age group and classroom with occupancy rate, tuition revenue, and subsidized-slot analysis
- Subsidy reimbursement timing adjustment for 30–60 day government voucher payment lag built into both the weekly projection and monthly indirect cash flow statement
- Bi-weekly payroll planning rows aligned to actual pay dates — the single largest recurring cash outflow for most childcare centers
- Labor cost ratio, occupancy rate, revenue per enrolled child, and subsidy concentration calculations — the four metrics childcare lenders and licensing agencies look at
- CACFP food program reimbursement tracking to net meal program costs against federal reimbursements correctly
How to Use This Daycare Cash Flow Spreadsheet
Download the .xlsx file and open it in Excel or Google Sheets. Start with the Enrollment & Revenue Tracker — enter your licensed capacity and current enrollment for each age group, your tuition rates, and how many slots are filled by subsidy vouchers versus private-pay families. This gives you your baseline revenue picture and calculates your current occupancy rate immediately. Then enter your current subsidy receivables: the dollar amount that has been earned but not yet reimbursed by your state or county agency. This number is the starting point for understanding your cash position, because a center with $30,000 in outstanding subsidy isn't cash-rich — it's waiting on a check.
Move to the 13-Week Cash Flow sheet and fill in your projected tuition collections week by week. Weekly-pay families are straightforward — you can estimate collection based on current enrollment and your collection rate. Monthly-pay families all land in the same one or two weeks at the start of the month, which creates a cash spike followed by a flat period. Subsidy reimbursements should be projected based on your agency's historical payment pattern — if they pay 45 days after the care month ends, enter those inflows in the correct week. Enter your bi-weekly payroll dates and amounts in the expense rows — this is the most important thing to get right, because payroll is non-negotiable and the weeks it aligns with low tuition collection or delayed subsidy payments are where cash shortfalls happen.
15 minutes from download to your first cash flow projection
Download the template, enter your enrollment by age group and your current subsidy receivables, and see your daycare's full cash picture — 13-week projection, enrollment tracker, and monthly statement included.
Why Daycares Need a Dedicated Cash Flow Template
Daycare centers face a cash flow structure that most business financial models aren't built for. Revenue is theoretically stable — most centers bill flat tuition regardless of attendance — but two factors create persistent cash gaps. First, government subsidy programs, which fund 20–60% of enrollment at most community-based centers, reimburse on a 30–60 day lag. A center serving 40 subsidized children at an average state rate of $800/month has earned $32,000 in a given month that won't arrive for six weeks. Second, payroll hits bi-weekly on fixed calendar dates that don't align with monthly tuition collection, so there are weeks when the payroll outflow significantly exceeds the week's cash inflows. Neither of these is a sign of a troubled business — it's just how childcare cash flow works — but it requires week-by-week visibility that a monthly income statement doesn't provide.
The financial metrics that matter most in childcare are occupancy rate and labor cost ratio. Occupancy rate — enrolled children divided by licensed capacity — needs to stay above 85% for most centers to cover fixed costs. At 70% occupancy, most centers are losing money; at 90%, they're typically profitable at net margins of 10–16%. Labor cost ratio is the operating lever: teachers, assistants, and aides need to be scheduled to meet licensing ratio requirements, which means labor costs are somewhat fixed regardless of daily attendance. The target is to keep total payroll and benefits below 65% of revenue, which requires both strong enrollment and efficient scheduling. Centers that track these two metrics monthly catch enrollment slide before it becomes a financial crisis, because the gap between 90% and 80% occupancy at a 50-child center represents roughly $4,000–$6,000 per month in lost revenue against a mostly fixed cost base.
Daycare Industry at a Glance
Financial templates built for daycare centers and childcare providers — pre-loaded with tuition billing categories, subsidy tracking, and the KPIs that determine whether a center is actually making money.
Revenue Drivers
- Weekly/monthly tuition by age group
- Government subsidies and voucher programs
- Before/after school care
- Drop-in and part-time care
- Enrichment classes and summer programs
Key Cost Categories
- Payroll and benefits (50-70% of revenue)
- Rent and occupancy
- Food and meals program
- Supplies and curriculum materials
- Insurance and licensing
- Utilities
- Marketing and enrollment
Typical Margins
Gross: 30-50% · Net: 10-16%
Seasonality
Peak enrollment in August-September (school year start) and January-February. Summer dip for school-age programs. Revenue is more stable than attendance because most centers bill flat tuition regardless of days attended.
Key Performance Indicators
Daycare Cash Flow Template FAQ
More Daycare Templates
Daycare Balance Sheet Template for Excel
$29
Daycare Budget Template for Excel
$29
Daycare Business Plan Template for Excel
$39
Daycare Expense Tracker Template for Excel
$29
Daycare Financial Model Template for Excel
$29
Daycare Income Statement Template for Excel
$29
Daycare Invoice Template for Excel
$29
Daycare KPI Dashboard Template for Excel
$29
Daycare P&L Template for Excel
$29
Daycare Pro Forma Template for Excel
$29
Daycare Project Budget Template for Excel
$29
Daycare Sales Forecast Template for Excel
$29
Daycare Business Valuation Template for Excel
$29
Daycare Cash Flow Template
$29