Daycare Financial Model Template
Model your daycare's full financial picture — tuition revenue by age group, subsidy income, payroll, and occupancy rate — in a single connected Excel workbook.
What's Inside This Daycare Financial Model Template
This template includes 6 worksheets, each designed for a specific part of your daycare financial workflow:
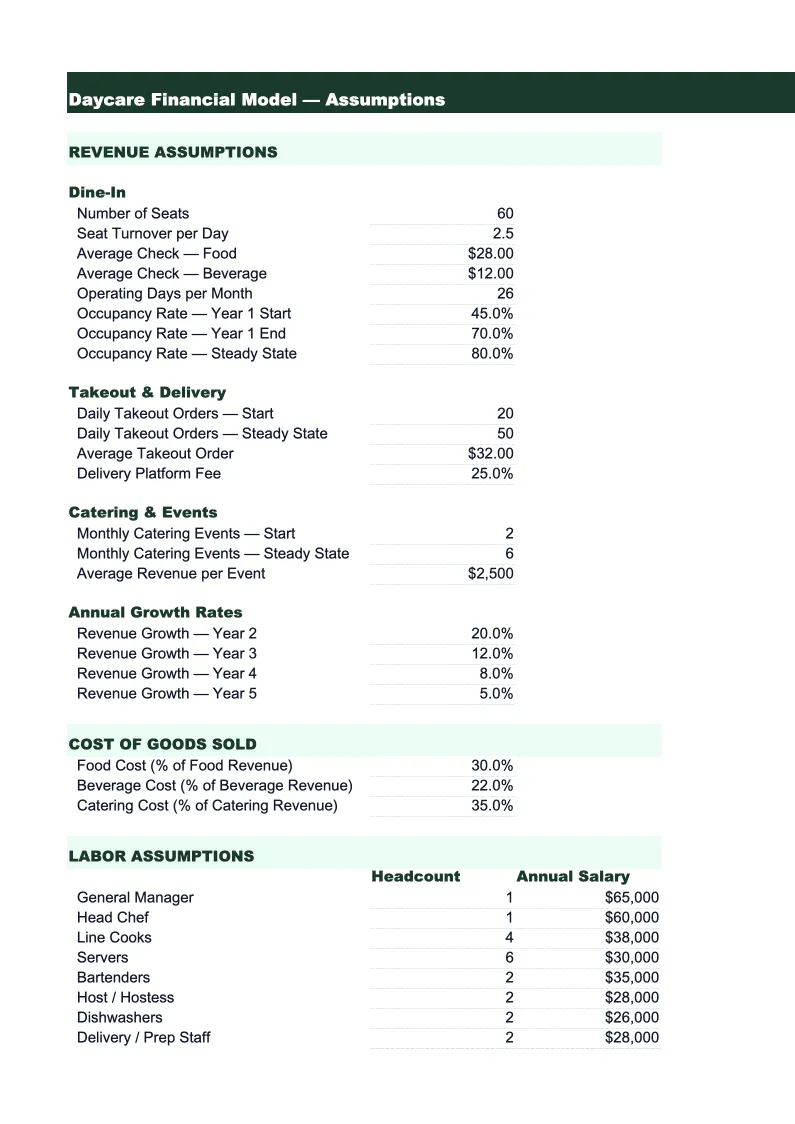
Assumptions
The control panel for the entire model.
Revenue Projections
Builds your monthly revenue forecast from the ground up, starting with licensed capacity and applying your occupancy assumptions to derive enrolled headcount by age group.
Expense Model
A detailed monthly expense forecast organized around the five cost buckets that drive daycare profitability.
P&L
A monthly and annual profit and loss statement that flows directly from the revenue and expense sheets.
Cash Flow
A monthly cash flow statement that reconciles your net income with actual cash movement.
KPI Dashboard
A single-page summary of the five metrics that determine whether a daycare center is performing well: occupancy rate by age group, labor cost ratio (payroll as a percentage of revenue), revenue per enrolled child, subsidy dependency ratio, and net margin.
Daycare Financial Model Template Features
- Enrollment and revenue model by age group with ratio-based staffing calculations
- Separate tracking for private-pay tuition and government subsidy income (CCAP, CCDF)
- Payroll cost calculator based on state licensing ratios per age group
- CACFP meals program expense tracking built into the expense model
- Occupancy rate and labor cost ratio auto-calculated and charted monthly
- 3-statement model: P&L, cash flow, and KPI dashboard connected to one assumptions sheet
How to Use This Daycare Financial Model Spreadsheet
Start with the Assumptions sheet — it drives everything else. Enter your licensed capacity by age group, your current or planned tuition rates, and your occupancy assumptions. If you're modeling an existing center, use your current enrollment numbers and tuition schedule. If you're planning a new center, research your local competitors' rates and set conservative occupancy targets: 70% in year one, 85% by year two is a reasonable baseline for most markets. Once your assumptions are in, the revenue sheet will populate automatically.
Move to the Expense Model next and fill in your payroll data. The model pre-builds staffing ratios by age group based on common state licensing requirements — adjust these to match your state's specific ratios. Enter your hourly wage rates for lead teachers, assistant teachers, and directors separately, since these typically differ. Then work through the remaining expense categories: rent and utilities from your lease, food costs from your CACFP reimbursement rates and any co-pay, and fixed overhead items like insurance and licensing fees.
15 minutes from download to your first daycare financial model
Download the template, enter your enrollment capacity and tuition rates, and see your daycare's full financial picture — revenue by age group, labor costs, occupancy KPIs, and net margin.
Why Every Daycare Needs a Financial Model
Running a daycare without a financial model is operating on gut feel in an industry where margins are thin and expenses are locked in. Payroll alone runs 50–65% of revenue at most childcare centers, and because state licensing ratios require minimum staffing regardless of enrollment, a center that drops from 90% occupancy to 75% can swing from profitable to break-even in a single month. The only way to see that exposure ahead of time is to model it — and that means having a connected spreadsheet that links your enrollment assumptions to your staffing costs and cash position.
Daycare revenue has structural complexity that generic financial templates don't handle. Most centers collect tuition from private-pay families and government subsidies through CCAP, CCDF, or local childcare voucher programs, and these two income streams behave very differently. Private-pay is collected weekly or monthly and predictable. Subsidies arrive on state reimbursement cycles that lag enrollment by weeks, vary by child, and come with utilization requirements. A good daycare financial model separates these streams so you know your subsidy dependency ratio — the share of revenue that depends on government funding — and can stress-test what happens if subsidy rates change or reimbursements are delayed.
Daycare Industry at a Glance
Financial templates built for daycare centers and childcare providers — pre-loaded with tuition billing categories, subsidy tracking, and the KPIs that determine whether a center is actually making money.
Revenue Drivers
- Weekly/monthly tuition by age group
- Government subsidies and voucher programs
- Before/after school care
- Drop-in and part-time care
- Enrichment classes and summer programs
Key Cost Categories
- Payroll and benefits (50-70% of revenue)
- Rent and occupancy
- Food and meals program
- Supplies and curriculum materials
- Insurance and licensing
- Utilities
- Marketing and enrollment
Typical Margins
Gross: 30-50% · Net: 10-16%
Seasonality
Peak enrollment in August-September (school year start) and January-February. Summer dip for school-age programs. Revenue is more stable than attendance because most centers bill flat tuition regardless of days attended.
Key Performance Indicators
Daycare Financial Model Template FAQ
More Daycare Templates
Daycare Balance Sheet Template for Excel
$29
Daycare Budget Template for Excel
$29
Daycare Business Plan Template for Excel
$39
Daycare Cash Flow Template for Excel
$29
Daycare Expense Tracker Template for Excel
$29
Daycare Income Statement Template for Excel
$29
Daycare Invoice Template for Excel
$29
Daycare KPI Dashboard Template for Excel
$29
Daycare P&L Template for Excel
$29
Daycare Pro Forma Template for Excel
$29
Daycare Project Budget Template for Excel
$29
Daycare Sales Forecast Template for Excel
$29
Daycare Business Valuation Template for Excel
$29
More Financial Model Templates
Daycare Financial Model Template
$29