Daycare P&L Template
Track your daycare center's tuition revenue, subsidy income, and staffing costs with a P&L template built around the financial metrics that actually run a childcare business.
What's Inside This Daycare P&L Template
This template includes 4 worksheets, each designed for a specific part of your daycare financial workflow:
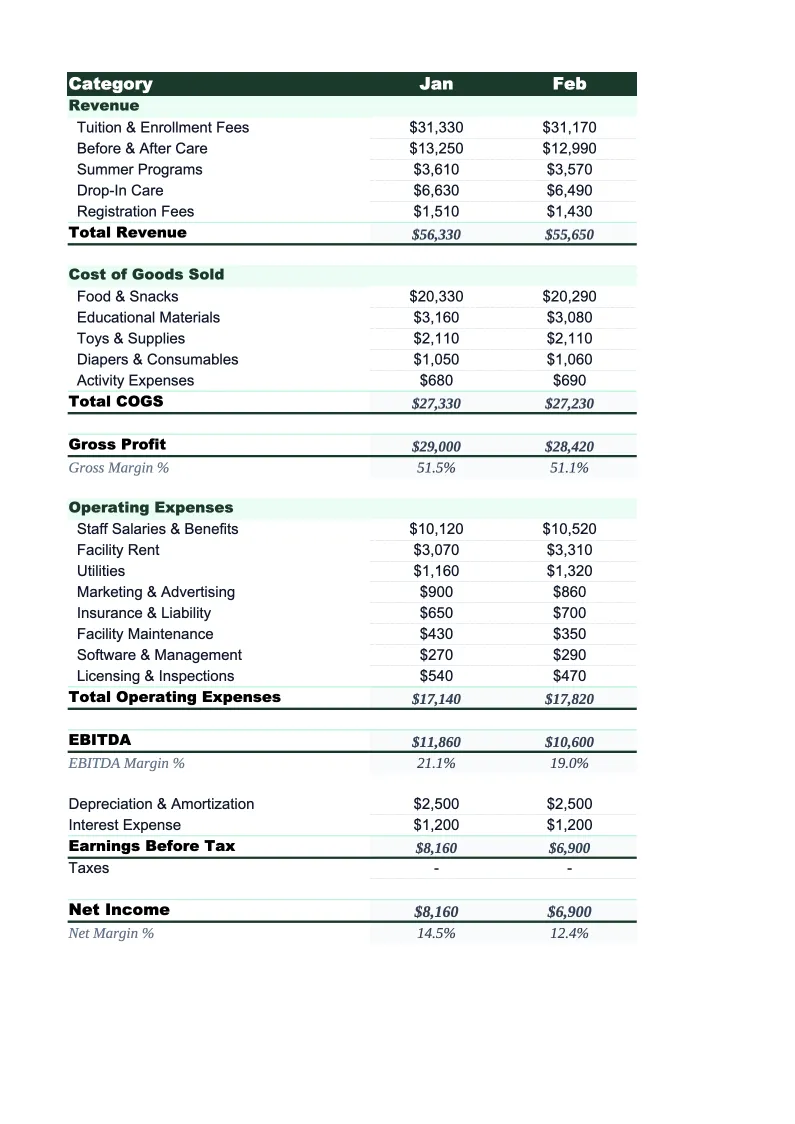
Monthly P&L
The core worksheet for entering each month's revenue and expenses.
Annual P&L
A 12-month summary that pulls automatically from the Monthly P&L sheet.
Occupancy & Revenue Tracker
A dedicated worksheet for tracking licensed capacity, enrolled children, and revenue by age group room.
Dashboard
A one-page visual summary with pre-built charts and key financial metrics for the current month and year to date.
Daycare P&L Template Features
- Revenue split by tuition age group, subsidies, before/after school, and enrichment
- Labor cost ratio calculated automatically each month (target: below 65%)
- Occupancy rate tracker by age group room with capacity and enrollment
- CACFP food reimbursement line item built into the expense structure
- 12-month annual P&L view with full-year totals and seasonal trend visibility
- Visual dashboard showing revenue by source, labor ratio, and occupancy over time
How to Use This Daycare P&L Spreadsheet
Download the .xlsx file and open it in Excel or Google Sheets — no macros or add-ins needed. Start with the Monthly P&L sheet and review the pre-loaded revenue and expense categories. Most daycare centers can use the template as-is with minor adjustments: confirm your age group structure matches the room labels, verify that your subsidy programs are listed correctly, and add any enrichment programs or fee types that aren't already included. Initial setup takes 15–20 minutes and you only need to do it once.
Each month, pull your tuition billing records, subsidy payment remittances, and expense summaries and enter the totals by category. If you use childcare management software like Brightwheel, Procare, or HiMama, most can export a monthly revenue report you can use as your source. Fill in the licensed slots and current enrollment figures in the Occupancy & Revenue Tracker to unlock the occupancy rate calculations — that single number drives more staffing and expansion decisions than anything else on the P&L.
15 minutes from download to your first P&L
Download the template, enter last month's tuition revenue and expenses, and see your occupancy rate and labor cost ratio calculated automatically.
Why Every Daycare Center Needs a P&L Template
Daycare is a labor-intensive business running on tighter margins than most owners expect. Payroll alone consumes 50–70% of revenue for most centers, licensing ratios set a hard floor on staffing costs, and raising prices is constrained by what local families and subsidy programs will pay. At the same time, revenue looks more stable than it is — flat tuition billing masks the fact that a single withdrawal can erase an entire room's profit if that room was already running lean on enrollment. Without a monthly P&L to surface those dynamics, problems stay hidden in the bank account until they become urgent.
A daycare P&L needs a structure that reflects how childcare revenue actually works. Tuition income should be tracked by age group because infant and toddler rooms generate higher revenue per child but also carry higher licensing costs (lower ratios mean more staff per child). Subsidy payments need their own line because they arrive on a different billing cycle and at different rates than private tuition — and because subsidy dependency as a percentage of total revenue is a risk metric lenders and investors look at. Food program reimbursements through CACFP are often entered as income by some centers and as an offset to food costs by others; the template handles both approaches clearly so your net food expense reflects reality.
Daycare Industry at a Glance
Financial templates built for daycare centers and childcare providers — pre-loaded with tuition billing categories, subsidy tracking, and the KPIs that determine whether a center is actually making money.
Revenue Drivers
- Weekly/monthly tuition by age group
- Government subsidies and voucher programs
- Before/after school care
- Drop-in and part-time care
- Enrichment classes and summer programs
Key Cost Categories
- Payroll and benefits (50-70% of revenue)
- Rent and occupancy
- Food and meals program
- Supplies and curriculum materials
- Insurance and licensing
- Utilities
- Marketing and enrollment
Typical Margins
Gross: 30-50% · Net: 10-16%
Seasonality
Peak enrollment in August-September (school year start) and January-February. Summer dip for school-age programs. Revenue is more stable than attendance because most centers bill flat tuition regardless of days attended.
Key Performance Indicators
Daycare P&L Template FAQ
More Daycare Templates
Daycare Balance Sheet Template for Excel
$29
Daycare Budget Template for Excel
$29
Daycare Business Plan Template for Excel
$39
Daycare Cash Flow Template for Excel
$29
Daycare Expense Tracker Template for Excel
$29
Daycare Financial Model Template for Excel
$29
Daycare Income Statement Template for Excel
$29
Daycare Invoice Template for Excel
$29
Daycare KPI Dashboard Template for Excel
$29
Daycare Pro Forma Template for Excel
$29
Daycare Project Budget Template for Excel
$29
Daycare Sales Forecast Template for Excel
$29
Daycare Business Valuation Template for Excel
$29
Daycare P&L Template
$29