Healthcare Pro Forma Template
Project a medical practice's revenue by payer mix, clinical staffing costs, accounts receivable timing, and operating expenses across 5 years — with pre-built formulas for net collection rate, days in AR, and break-even patient volume.
What's Inside This Healthcare Pro Forma Template
This template includes 7 worksheets, each designed for a specific part of your healthcare financial workflow:
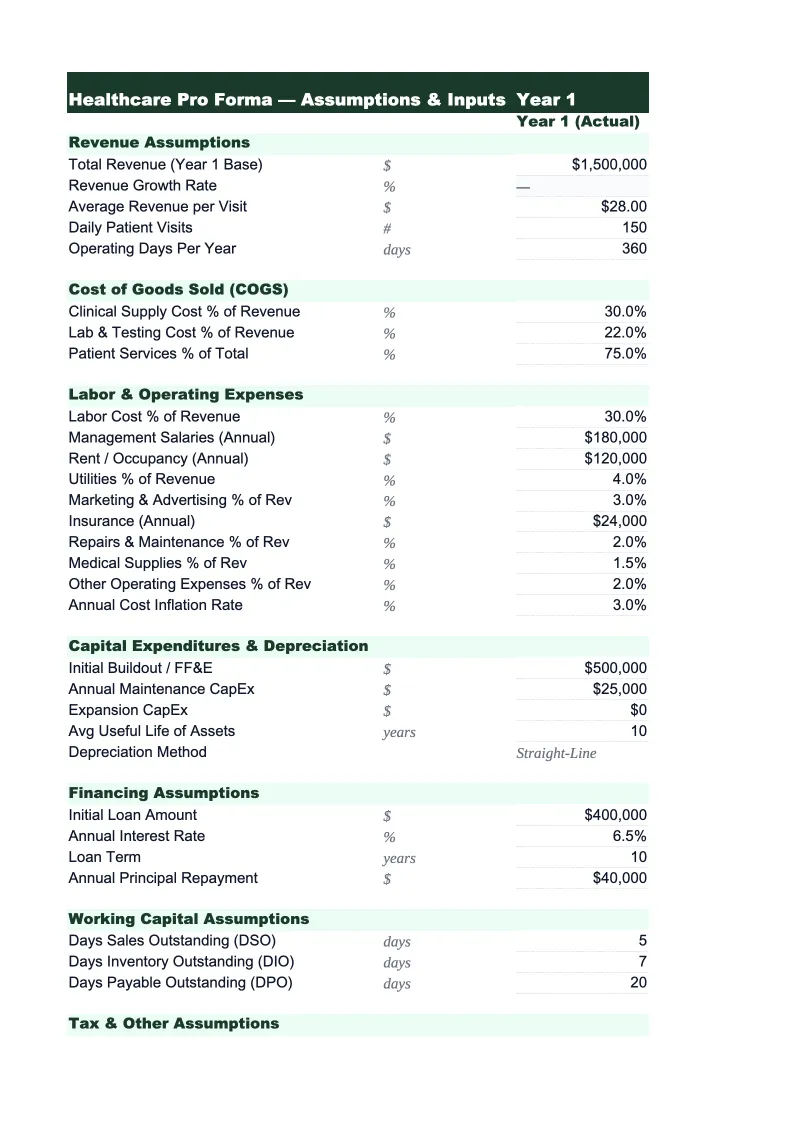
Assumptions
The central input sheet for the entire model.
Revenue Projections
Projects total practice revenue by month for year one and annually through year five, broken out by payer class (Medicare, Medicaid, commercial insurance, workers' comp, and self-pay) and by provider.
AR & Collections
Models the accounts receivable cycle and cash timing specific to healthcare billing.
Operating Expenses
Covers all costs of running the practice: clinical staff (physicians, nurse practitioners, physician assistants, medical assistants, and nurses with separate salary lines for each), administrative and billing staff (front desk, coders, billing specialists), occupancy (rent, CAM, leasehold improvements amortization), medical supplies and drugs, malpractice insurance, EMR and practice management software, continuing medical education, marketing and patient acquisition, credentialing fees, and general administrative costs.
5-Year P&L Summary
An annual summary showing total net revenue (after contractual adjustments), total operating expenses broken into clinical labor, administrative labor, occupancy, supplies, and overhead, EBITDA, and net income side by side for each of the five projected years.
Cash Flow Projection
A monthly cash flow model for year one and an annual summary through year five, designed around the specific cash-timing challenges of healthcare.
Break-Even Analysis
Calculates the monthly patient visit volume a medical practice needs to cover all fixed and variable costs, expressed both as total visits and as visits per provider per day — which is the more actionable metric for practice managers.
Healthcare Pro Forma Template Features
- Revenue model by payer class (Medicare, Medicaid, commercial, self-pay) with contracted rate and collection percentage per payer
- AR and collections module tracking clean claim rate, denial rate, and days-in-AR with monthly aging buckets
- Clinical staffing model with wRVU-based physician compensation, support staff ratios, and benefits load
- Monthly cash flow with AR lag timing by payer and startup cost waterfall for new practice financing
- 5-year P&L summary with overhead rate, net collection rate, revenue per provider, and net income per provider
- Break-even analysis by visit volume and visits-per-provider-per-day across variable payer mix scenarios
How to Use This Healthcare Pro Forma Spreadsheet
Start with the Assumptions sheet. The most important inputs are your payer mix percentages and your contracted reimbursement rates by payer class — these two variables drive more of the financial outcome than any other. If you're modeling an existing practice, pull your last 12 months of explanation of benefits statements to calculate your actual contracted rates and collection percentages by payer. If you're projecting a startup practice, use your specialty's Medicare fee schedule as a baseline and model commercial rates at 110–140% of Medicare depending on your market and specialty. Set your visit volume assumptions conservatively for year one — most new practices build to full panels over 12–18 months, and credentialing delays alone can push the first commercial insurance payment out 90–120 days from opening.
Once Assumptions are set, review the AR & Collections sheet carefully. The gap between gross charges and collected revenue is one of the most misunderstood aspects of medical practice finance, and it's where many practice pro formas are overstated. Enter your expected clean claim rate (95%+ is achievable with good billing processes; 80–85% is common without dedicated billing staff), your first-pass denial rate by payer, and your days-in-AR target. These inputs will make your cash flow projection materially different from a naive model that assumes revenue equals collections. Then move to Operating Expenses and enter your actual or quoted staffing costs — physician compensation in particular needs to reflect your specialty's benchmark (the MGMA Physician Compensation and Production Survey is the standard reference), or the model will not be credible to lenders with healthcare experience.
From download to lender-ready projections in under an hour
Enter your payer mix, contracted rates, and staffing model — the template builds your 5-year revenue, collections, operating expenses, and cash flow analysis automatically.
Why Every Medical Practice Needs a Pro Forma
Medical practice finance is fundamentally different from most other businesses because revenue is determined not by what you charge, but by what payers have agreed to pay — and because cash arrives weeks to months after services are delivered. A practice billing $500,000 in gross charges per month might collect $350,000 net, and that $350,000 might not arrive in the bank until 45–60 days later. This combination of contractual revenue adjustments and AR lag means that a practice can be clinically busy, fully staffed, and still run negative cash for months — which is why pro forma financial projections are essential for any new practice launch, expansion, or financing event. The model has to be built around net collected revenue, not gross charges, and it has to model cash timing explicitly.
The financial metrics that define practice health are net collection rate (the percentage of allowed charges actually collected — 90–95% is the target; below 85% indicates a billing problem), overhead rate as a percentage of net collections (under 55–60% for most specialties, though primary care typically runs higher), days in accounts receivable (under 30 for best-in-class practices; 45–60 days is typical), and revenue per physician FTE (varies widely by specialty — primary care averages $250,000–$400,000 in collections per physician; surgical specialties often $600,000–$1.5M+). Physician compensation typically represents 20–35% of total collections for employed physicians on productivity-based contracts, with wRVU-based compensation being the most common structure. Understanding these benchmarks is what separates a credible healthcare pro forma from one a lender will discount.
Healthcare Industry at a Glance
Financial templates built for healthcare practices — from private clinics and therapy offices to specialty practices and medical groups. Pre-loaded with billing categories, insurance reimbursement tracking, and healthcare-specific KPIs.
Revenue Drivers
- Insurance reimbursements
- Patient copays and coinsurance
- Out-of-pocket self-pay
- Capitation payments
Key Cost Categories
- Clinical staff salaries
- Administrative and billing staff
- Medical supplies
- Malpractice insurance
- EMR/EHR software
- Facility rent and occupancy
Typical Margins
Gross: 45-65% · Net: 10-25%
Seasonality
Higher patient volume in fall/winter flu season; slower in summer. End-of-year spike as patients meet deductibles.
Key Performance Indicators
Healthcare Pro Forma Template FAQ
More Healthcare Templates
Healthcare Balance Sheet Template for Excel
$29
Healthcare Budget Template for Excel
$29
Healthcare Business Plan Template for Excel
$39
Healthcare Cash Flow Template for Excel
$29
Healthcare Expense Tracker Template for Excel
$29
Healthcare Financial Model Template for Excel
$29
Healthcare Income Statement Template for Excel
$29
Healthcare Invoice Template for Excel
$29
Healthcare KPI Dashboard Template for Excel
$29
Healthcare P&L Template for Excel
$29
Healthcare Project Budget Template for Excel
$29
Healthcare Sales Forecast Template for Excel
$29
Healthcare Practice Valuation Template for Excel
$29
Healthcare Pro Forma Template
$29