Healthcare KPI Dashboard Template
Track collections rate, days in A/R, denial rate, provider productivity, and the other KPIs that determine whether your medical practice is financially healthy.
What's Inside This Healthcare KPI Dashboard Template
This template includes 5 worksheets, each designed for a specific part of your healthcare financial workflow:
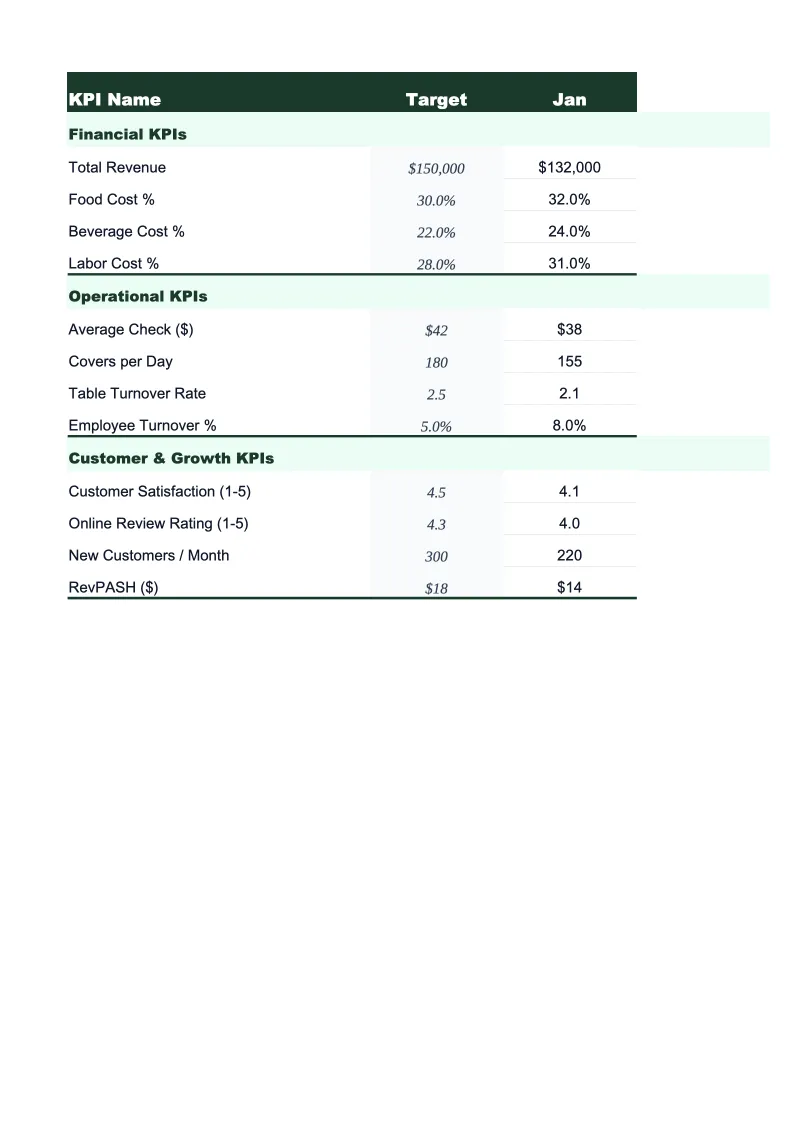
KPI Dashboard
The main visual overview showing your practice's most important performance metrics at a glance.
Revenue & Collections
A structured worksheet for tracking the billing and collections metrics that drive practice revenue.
Patient Volume Tracker
Track visit volume, appointment capacity, no-show rates, and new versus returning patients across providers and locations.
Provider Productivity
A per-provider breakdown of the volume and revenue metrics used to evaluate clinical staff performance.
12-Month Trends
A rolling 12-month view of your most critical KPIs plotted as line and bar charts.
Healthcare KPI Dashboard Features
- 20+ pre-loaded healthcare KPIs including collections rate, A/R days, and denial rate
- Payer mix breakdown by commercial, Medicare, Medicaid, and self-pay
- Per-provider RVU and productivity tracking with specialty benchmarks
- No-show rate and capacity utilization tracking by provider and location
- Color-coded status indicators against your set targets
- 12-month trend charts for collections, volume, and revenue per visit
How to Use This Medical Practice KPI Spreadsheet
Start with the KPI Dashboard tab and set your targets in the Monthly Scorecard. If you don't have established benchmarks yet, the template ships with pre-populated ranges based on MGMA and HFMA industry data — collections rate target of 95%+, A/R days below 30, denial rate below 5%. These give you a working baseline from day one. Setting up targets takes about 15 minutes; adjust them to reflect your specialty and payer mix once you have a few months of actuals.
Enter your billing data monthly in the Revenue & Collections sheet. You'll need your practice management system or billing software report for the period: total charges, adjustments by payer, collections, and write-offs. The denial tracking section is worth five extra minutes — enter your top three denial reasons by payer each month and within a quarter you'll see which insurers are systematically denying the same codes, which is often the easiest revenue recovery opportunity a practice has. Patient volume data goes into the Patient Volume Tracker simultaneously.
15 minutes from download to your first KPI review
Download the template, enter your targets, and start tracking the collections, volume, and productivity metrics that actually determine whether your practice is financially healthy.
Why Every Medical Practice Needs a KPI Dashboard
Medical practices generate revenue when they bill for services — but billing is not the same as collecting. The gap between charges and cash received is where most practice financial problems hide. A practice with strong patient volume and poor collections management can still operate at a loss: commercial insurers deny claims that don't meet documentation standards, Medicaid reimbursements arrive weeks late, and self-pay balances accumulate uncollected. Tracking the right KPIs weekly and monthly is how practices catch these problems while they're still fixable rather than discovering them at year-end.
The metrics that matter most for practice financial health cluster around three areas. Collections and billing: net collection rate should be above 95%, gross collection rate above 45–50% depending on your payer mix, and days in A/R below 30 for most outpatient settings. Denial rate below 5% is the industry benchmark; anything above 7–8% signals a systematic billing or documentation problem worth investigating. Patient volume: no-show rates in most specialties run 5–15%, and bringing that down by even 3–4 percentage points meaningfully improves capacity utilization without adding a single new provider. Provider productivity: RVUs per provider per day benchmarked to specialty norms help you identify whether clinical capacity is being used efficiently and whether any provider is carrying an unsustainable load.
Healthcare Industry at a Glance
Financial templates built for healthcare practices — from private clinics and therapy offices to specialty practices and medical groups. Pre-loaded with billing categories, insurance reimbursement tracking, and healthcare-specific KPIs.
Revenue Drivers
- Insurance reimbursements
- Patient copays and coinsurance
- Out-of-pocket self-pay
- Capitation payments
Key Cost Categories
- Clinical staff salaries
- Administrative and billing staff
- Medical supplies
- Malpractice insurance
- EMR/EHR software
- Facility rent and occupancy
Typical Margins
Gross: 45-65% · Net: 10-25%
Seasonality
Higher patient volume in fall/winter flu season; slower in summer. End-of-year spike as patients meet deductibles.
Key Performance Indicators
Healthcare KPI Dashboard Template FAQ
More Healthcare Templates
Healthcare Balance Sheet Template for Excel
$29
Healthcare Budget Template for Excel
$29
Healthcare Business Plan Template for Excel
$39
Healthcare Cash Flow Template for Excel
$29
Healthcare Expense Tracker Template for Excel
$29
Healthcare Financial Model Template for Excel
$29
Healthcare Income Statement Template for Excel
$29
Healthcare Invoice Template for Excel
$29
Healthcare P&L Template for Excel
$29
Healthcare Pro Forma Template for Excel
$29
Healthcare Project Budget Template for Excel
$29
Healthcare Sales Forecast Template for Excel
$29
Healthcare Practice Valuation Template for Excel
$29
More KPI Dashboard Templates
Healthcare KPI Dashboard Template
$29