Healthcare P&L Template
Track revenue and profitability for your medical practice with a P&L template built around healthcare billing, payer mix, and clinical staffing costs.
What's Inside This Healthcare P&L Template
This template includes 6 worksheets, each designed for a specific part of your healthcare financial workflow:
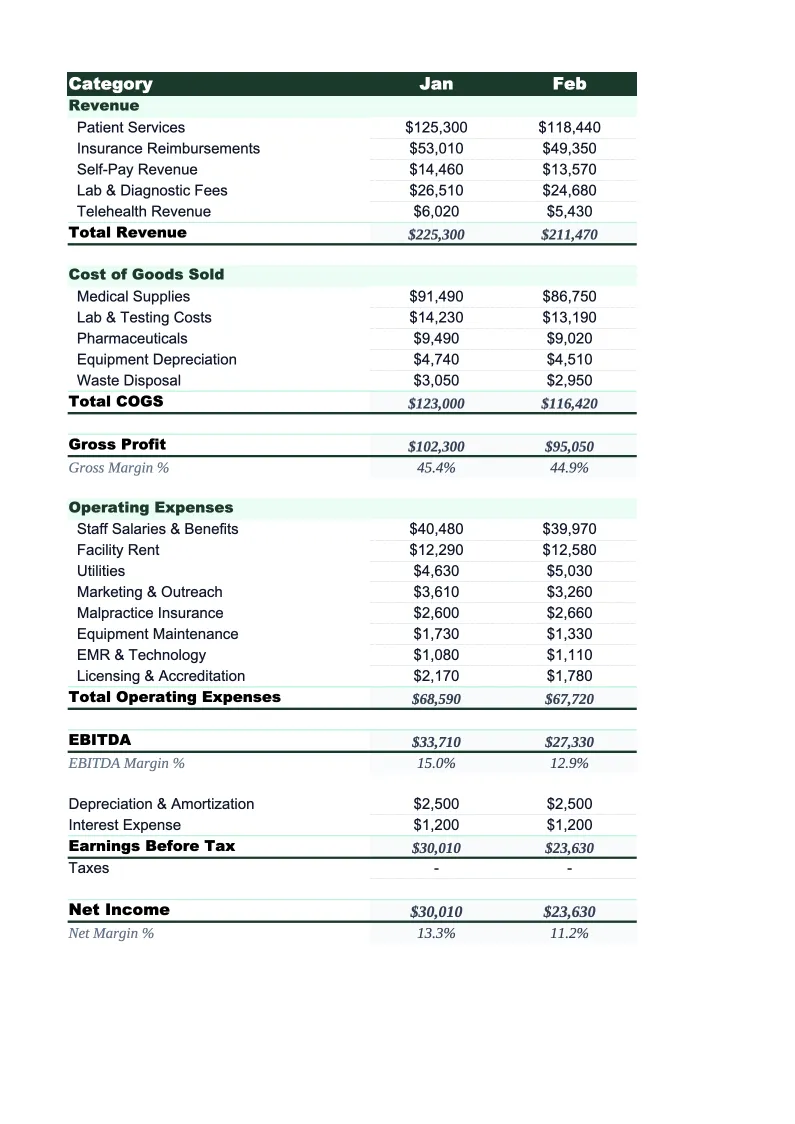
Monthly P&L
The core worksheet where you record each month's revenue and expenses.
Annual Summary
A full-year rollup that consolidates all 12 monthly P&Ls into a single view.
Payer Mix Analysis
A dedicated worksheet that breaks down your revenue by payer type and calculates the percentage each payer contributes to total collections.
Provider Productivity
Tracks revenue and RVU (relative value unit) production per provider, alongside each provider's direct cost — salary, benefits, and malpractice premium.
AR Aging Summary
Summarizes outstanding accounts receivable by payer and by aging bucket — current, 30–60 days, 61–90 days, and 90+ days.
Dashboard
A one-page visual summary with pre-built charts for payer mix breakdown, monthly revenue trends, net collection rate over time, and the practice's key profitability ratios.
Healthcare P&L Template Features
- Revenue tracked by payer type: commercial, Medicare, Medicaid, and self-pay
- Clinical and administrative expense categories pre-loaded
- Provider productivity sheet with revenue-per-provider and cost-to-revenue ratios
- AR aging summary with net collection rate calculation
- Payer mix analysis to understand reimbursement impact
- Dashboard with charts for collection trends and margin KPIs
How to Use This Healthcare P&L Spreadsheet
Download the .xlsx file and open it in Excel or Google Sheets. Start with the Monthly P&L tab: review the pre-loaded payer categories and expense line items, and adjust them to match your practice's chart of accounts. Most practices keep the structure as-is and rename a few line items — for example, swapping 'mid-level provider' to match your specific role titles, or splitting malpractice insurance by specialty if you have multiple. This setup takes about 15 minutes.
Once the categories are set, enter your collections by payer type for the current month. Use your practice management system or billing software to pull total collected amounts by payer — not gross charges, not allowed amounts, but actual deposits. Then enter your expenses from your accounting system or bank statement. The sheet calculates gross margin, operating expenses, and net income automatically. Fill in the AR Aging Summary from your PM system's aging report.
15 minutes from download to your first P&L
Download the template, enter your collections by payer, and see your practice's profitability — by provider, by month, and across your full payer mix.
Why Every Medical Practice Needs a P&L Template
Healthcare practices operate on a different financial model than most businesses. Revenue isn't recognized when you provide a service — it's recognized when you actually collect from a payer, which can be 30–120 days later and at a rate that varies by payer contract. A practice that generates $1 million in gross charges might collect $650,000 after write-offs and denials. Without a P&L that separates collections by payer and tracks your net collection rate, you can't tell whether a drop in income came from treating fewer patients or from a payer-specific billing problem.
The expense side is equally complex. Clinical labor — physician salaries, mid-level compensation, and medical assistant wages — typically runs 35–55% of collections in a well-run practice. Administrative and billing costs add another 15–25%, and that number creeps up when denial rates rise and your billing team has to work claims repeatedly. The template breaks costs into these categories specifically so you can see the full cost-per-RVU picture and compare it against industry benchmarks: most primary care practices target a physician compensation-to-revenue ratio of 35–45%, while high-acuity specialty practices can run higher.
Healthcare Industry at a Glance
Financial templates built for healthcare practices — from private clinics and therapy offices to specialty practices and medical groups. Pre-loaded with billing categories, insurance reimbursement tracking, and healthcare-specific KPIs.
Revenue Drivers
- Insurance reimbursements
- Patient copays and coinsurance
- Out-of-pocket self-pay
- Capitation payments
Key Cost Categories
- Clinical staff salaries
- Administrative and billing staff
- Medical supplies
- Malpractice insurance
- EMR/EHR software
- Facility rent and occupancy
Typical Margins
Gross: 45-65% · Net: 10-25%
Seasonality
Higher patient volume in fall/winter flu season; slower in summer. End-of-year spike as patients meet deductibles.
Key Performance Indicators
Healthcare P&L Template FAQ
More Healthcare Templates
Healthcare Balance Sheet Template for Excel
$29
Healthcare Budget Template for Excel
$29
Healthcare Business Plan Template for Excel
$39
Healthcare Cash Flow Template for Excel
$29
Healthcare Expense Tracker Template for Excel
$29
Healthcare Financial Model Template for Excel
$29
Healthcare Income Statement Template for Excel
$29
Healthcare Invoice Template for Excel
$29
Healthcare KPI Dashboard Template for Excel
$29
Healthcare Pro Forma Template for Excel
$29
Healthcare Project Budget Template for Excel
$29
Healthcare Sales Forecast Template for Excel
$29
Healthcare Practice Valuation Template for Excel
$29
Healthcare P&L Template
$29