Healthcare Sales Forecast Template
Project your practice's revenue by patient volume, payer mix, and service line — with monthly breakdowns, reimbursement rate assumptions, and actual vs forecast tracking built in.
What's Inside This Healthcare Sales Forecast Template
This template includes 6 worksheets, each designed for a specific part of your healthcare financial workflow:
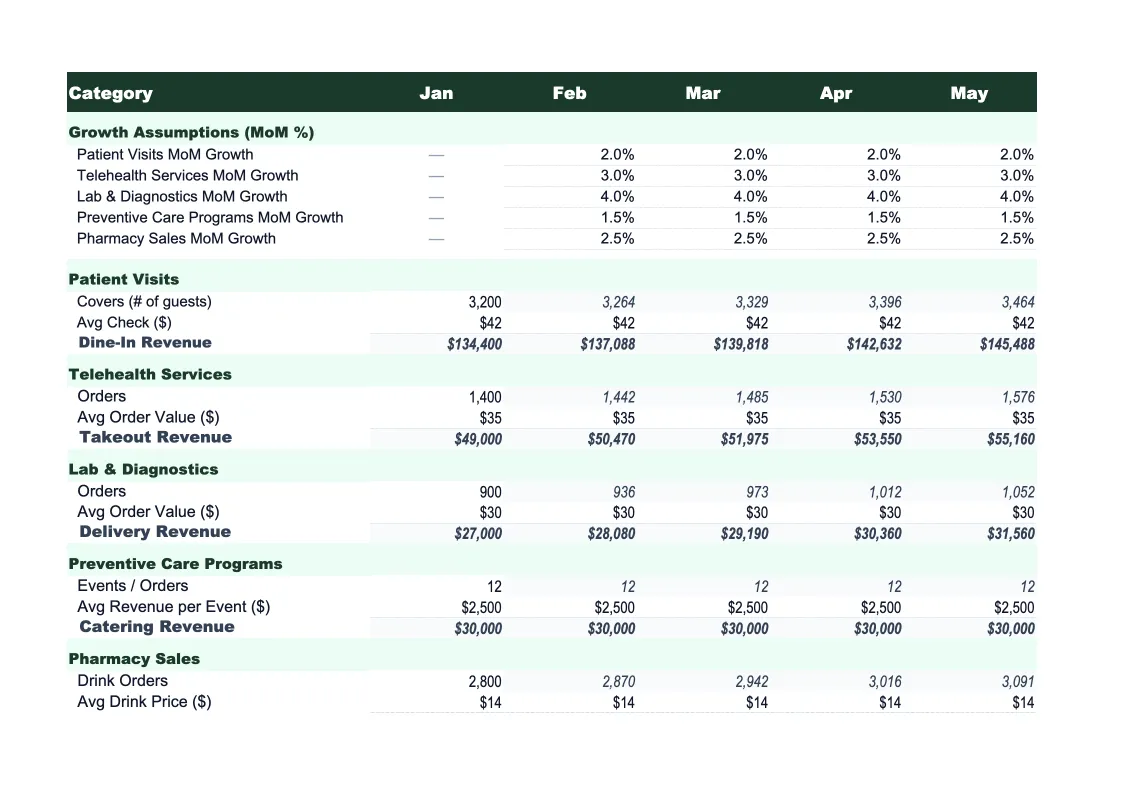
Assumptions
The central driver sheet that controls every projection in the model.
Monthly Forecast
The core projection sheet showing 12 months of expected revenue broken down by service line and payer category.
Annual Summary
A full-year view of projected revenue organized by service line and payer, with month-by-month columns and annual totals.
Actual vs Forecast
Enter actual monthly collections and charges alongside your projections to track forecast accuracy in real time.
Scenario Comparison
Three parallel forecast scenarios — base case, upside, and downside — built from different patient volume and payer mix assumptions.
Dashboard
A visual summary of your revenue forecast with pre-built charts: monthly projected revenue by service line (stacked bar), payer mix breakdown (pie chart showing relative contribution of Medicare, Medicaid, commercial, and self-pay), actual vs forecast trend line, and collection rate trend over the forecast period.
Healthcare Sales Forecast Template Features
- Driver-based model: patient visits × reimbursement rate × collection rate
- Revenue split by service line and payer class (Medicare, Medicaid, commercial, self-pay)
- Seasonal adjustment factors for flu season surges and summer slowdowns
- Three-scenario comparison (base, upside, downside) for payer mix and volume
- Actual vs forecast tracker with collection rate variance
- Visual dashboard with payer mix and revenue trend charts
How to Use This Healthcare Sales Forecast Spreadsheet
Start with the Assumptions sheet. Enter your expected weekly patient visit volume by service line — primary care visits, specialist consultations, preventive appointments, and any procedures your practice performs. Then set your payer mix: what percentage of patients are covered by Medicare, Medicaid, commercial insurance, and self-pay. If you have historical billing data, use last year's payer distribution as your starting point. Finally, enter your average reimbursement rate per visit for each payer class and your expected collection rate. This setup typically takes 30–45 minutes the first time, but it's the foundation that makes everything else meaningful.
Once your assumptions are in place, review the Monthly Forecast sheet to check whether the projections look realistic. Apply seasonal adjustment factors for months where volume shifts predictably — fall and winter typically bring a 10–20% volume increase from flu season, while July and August often run slower. The Scenario Comparison sheet is worth completing before you finalize your base case: set a conservative downside (lower visit volume or a worse payer mix) and a reasonable upside, then check whether the range brackets your actual expectations. Most practices find this exercise surfaces assumptions they hadn't made explicit before.
15 minutes from download to your first revenue forecast
Download the template, enter your patient volume and payer mix, and see your practice's projected monthly revenue — by service line, by payer, for the full year.
Why Every Medical Practice Needs a Sales Forecast Template
Healthcare revenue is harder to forecast than most practice owners expect, not because it's unpredictable, but because it requires tracking two different things at once: charges (what you bill) and collections (what you actually receive). The gap between them — contractual adjustments, claim denials, bad debt, and collection timing — is where most practices lose visibility. A well-built forecast models both sides, projecting gross charges by service line and payer, then applying collection rates to estimate net revenue. Without that structure, a practice can be generating strong charge volume while cash flow quietly deteriorates because denial rates are climbing or a payer is processing claims more slowly.
Payer mix is the most important variable in any healthcare revenue forecast, and it's one most practices don't track closely enough. Medicare pays at a fixed fee schedule; Medicaid typically pays 60–80% of what Medicare pays; commercial insurance rates vary by contract and can be 110–140% of Medicare depending on your negotiating leverage; self-pay collections average 10–30% of billed charges. A practice seeing a gradual shift toward higher Medicaid volume may look stable on visit counts while revenue per visit quietly erodes. Forecasting by payer class makes this visible before it shows up as a cash flow problem.
Healthcare Industry at a Glance
Financial templates built for healthcare practices — from private clinics and therapy offices to specialty practices and medical groups. Pre-loaded with billing categories, insurance reimbursement tracking, and healthcare-specific KPIs.
Revenue Drivers
- Insurance reimbursements
- Patient copays and coinsurance
- Out-of-pocket self-pay
- Capitation payments
Key Cost Categories
- Clinical staff salaries
- Administrative and billing staff
- Medical supplies
- Malpractice insurance
- EMR/EHR software
- Facility rent and occupancy
Typical Margins
Gross: 45-65% · Net: 10-25%
Seasonality
Higher patient volume in fall/winter flu season; slower in summer. End-of-year spike as patients meet deductibles.
Key Performance Indicators
Healthcare Sales Forecast Template FAQ
More Healthcare Templates
Healthcare Balance Sheet Template for Excel
$29
Healthcare Budget Template for Excel
$29
Healthcare Business Plan Template for Excel
$39
Healthcare Cash Flow Template for Excel
$29
Healthcare Expense Tracker Template for Excel
$29
Healthcare Financial Model Template for Excel
$29
Healthcare Income Statement Template for Excel
$29
Healthcare Invoice Template for Excel
$29
Healthcare KPI Dashboard Template for Excel
$29
Healthcare P&L Template for Excel
$29
Healthcare Pro Forma Template for Excel
$29
Healthcare Project Budget Template for Excel
$29
Healthcare Practice Valuation Template for Excel
$29
More Sales Forecast Templates
Healthcare Sales Forecast Template
$29