Hotel Sales Forecast Template
Project your hotel's revenue by rooms, ADR, occupancy, and department — with monthly breakdowns, seasonal factors, and actual vs forecast tracking built in.
What's Inside This Hotel Sales Forecast Template
This template includes 6 worksheets, each designed for a specific part of your hotel financial workflow:
Assumptions
The control panel for the entire model.
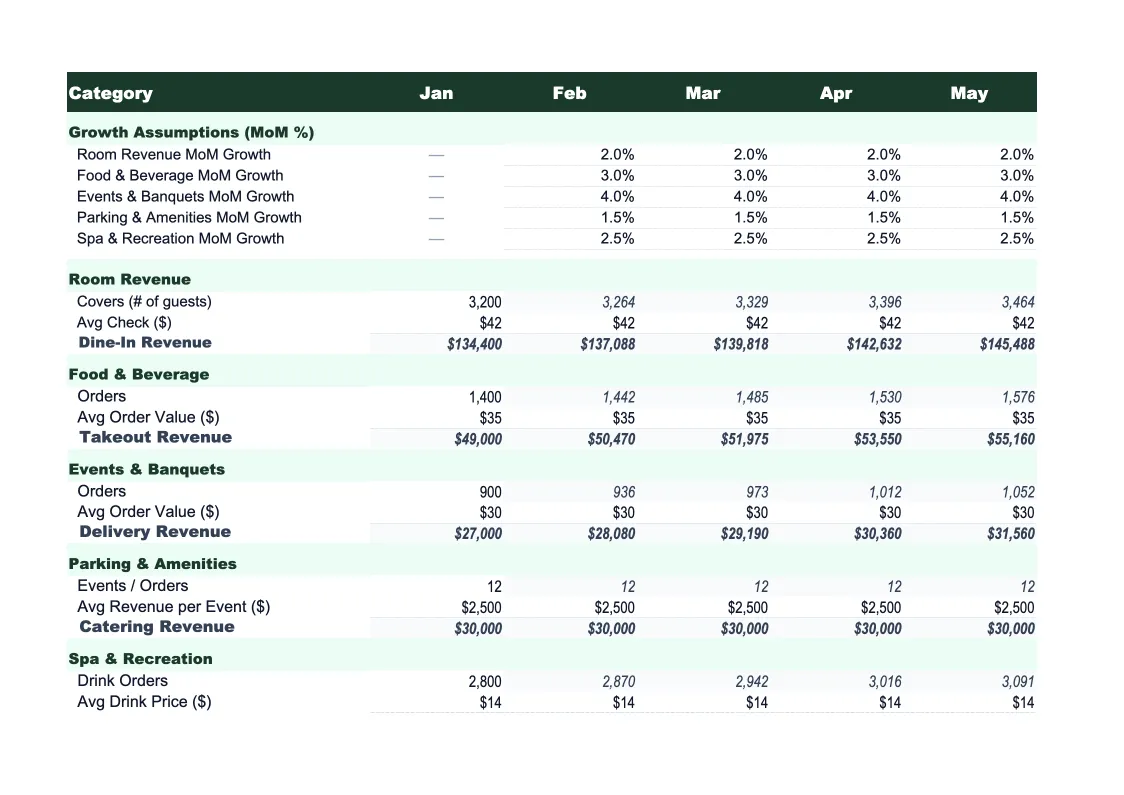
Monthly Forecast
The core projection sheet, showing 12 months of projected revenue across all departments.
Annual Summary
A full-year revenue rollup organized by department — Rooms, Food & Beverage, Meeting & Events, and Ancillary — with monthly columns and annual totals.
Actual vs Forecast
Enter your actual monthly revenue figures — rooms revenue from your PMS report, F&B from your POS, events from your sales system — alongside the forecast and the sheet calculates dollar and percentage variance for each department and line item.
Scenario Comparison
Three side-by-side revenue scenarios — base, upside, and downside — built from different occupancy, ADR, and department mix assumptions.
Dashboard
A visual summary of your hotel's revenue forecast with pre-built charts: monthly RevPAR trend, department revenue mix (stacked bar by month), occupancy rate vs ADR trend line, and actual vs forecast comparison chart.
Hotel Sales Forecast Template Features
- Driver-based model: rooms available × occupancy rate × ADR by guest segment
- Revenue split across Rooms, F&B, Meeting & Events, and Ancillary departments
- RevPAR and GOPPAR calculations built into the Annual Summary
- Seasonal adjustment factors by month for leisure and business demand shifts
- Three-scenario comparison (base, upside, downside) for owner and lender presentations
- Actual vs forecast tracker with department-level variance and rolling accuracy score
How to Use This Hotel Sales Forecast Spreadsheet
Start with the Assumptions sheet. Enter your total available rooms, your ADR targets by guest segment (transient, corporate, group), and your expected occupancy rates by month. If you have historical PMS data, use last year's actuals as your baseline — even rough estimates get you 80% of the way there on the first pass. Then fill in your F&B, meeting, and ancillary assumptions using revenue-per-occupied-room benchmarks. For a full-service hotel, F&B revenue typically runs $25–$60 per occupied room per night depending on your outlet mix. Most properties complete the Assumptions sheet in 30–45 minutes.
Once your assumptions are set, review the Monthly Forecast to sanity-check the numbers. Compare your projected RevPAR to your competitive set or last year's performance — if something looks off, trace it back to the assumption driving it. Apply seasonal adjustment factors for months where you know demand shifts significantly: summer leisure peaks, December holidays, the January valley. Fill out the Scenario Comparison sheet with a conservative downside (occupancy 10–15 points below base) and an optimistic upside, then check whether the range brackets your realistic expectations. This step adds 20 minutes but makes the forecast far more defensible.
15 minutes from download to your first revenue forecast
Download the template, plug in your ADR, occupancy, and department assumptions, and see your hotel's projected revenue — month by month, department by department.
Why Every Hotel Needs a Sales Forecast Template
Hotel revenue forecasting is different from most industries because a single property generates revenue across multiple departments simultaneously, and those departments behave differently. Rooms revenue is driven by occupancy and ADR — two variables that move in opposite directions when you discount to drive volume, creating a leverage dynamic that isn't obvious without modeling it explicitly. F&B revenue scales with occupied rooms but is also influenced by outlet mix and events on the books. Meeting and event revenue can spike your ADR-equivalent for group blocks while filling your restaurant and bar on shoulder nights. Without a forecast that captures all of these interactions, you're managing each department in isolation.
The highest-leverage metric in hotel forecasting is RevPAR — Revenue per Available Room — because it captures both the rate and the volume dimension simultaneously. A property running 90% occupancy at $120 ADR (RevPAR: $108) is generating more revenue than one running 70% occupancy at $150 ADR (RevPAR: $105), even though the second has a better rate. Segmentation matters too: transient leisure guests book through OTAs with 15–25% commission, eroding your net ADR; corporate negotiated accounts book at a fixed rate with no commission; group blocks lock in room revenue early but require F&B minimums. A well-built forecast models these segments separately so you can see what your channel mix is actually doing to your effective revenue.
Hotel Industry at a Glance
Financial templates built for hotels and hospitality businesses — from independent properties to branded franchises. Pre-loaded with room revenue, F&B, and event billing categories.
Revenue Drivers
- Room revenue (ADR × occupancy)
- Food & beverage
- Meeting & event space
- Spa & wellness
- Parking & ancillary fees
Key Cost Categories
- Labor (rooms, F&B, front office)
- Cost of F&B sold
- OTA & marketing commissions
- Utilities & property maintenance
- Franchise & management fees
- Administrative overhead
Typical Margins
Gross: 65-80% · Net: 10-20%
Seasonality
Business hotels peak weekdays and Q1/Q3; leisure properties peak summer and holidays. January is typically slowest for both segments.
Key Performance Indicators
Hotel Sales Forecast Template FAQ
More Hotel Templates
Hotel Balance Sheet Template for Excel
$29
Hotel Budget Template for Excel
$29
Hotel Business Plan Template for Excel
$39
Hotel Cash Flow Template for Excel
$29
Hotel Expense Tracker Template for Excel
$29
Hotel Financial Model Template for Excel
$29
Hotel Income Statement Template for Excel
$29
Hotel Invoice Template for Excel
$29
Hotel KPI Dashboard Template for Excel
$29
Hotel P&L Template for Excel
$29
Hotel Pro Forma Template for Excel
$29
Hotel Project Budget Template for Excel
$29
Hotel Valuation Template for Excel
$29
More Sales Forecast Templates
Hotel Sales Forecast Template
$29