Hotel Financial Model Template
Project room revenue by ADR and occupancy, model food and beverage, and track RevPAR and GOP% month by month — built specifically for hotel operators, owners, and hospitality investors.
What's Inside This Hotel Financial Model Template
This template includes 7 worksheets, each designed for a specific part of your hotel financial workflow:
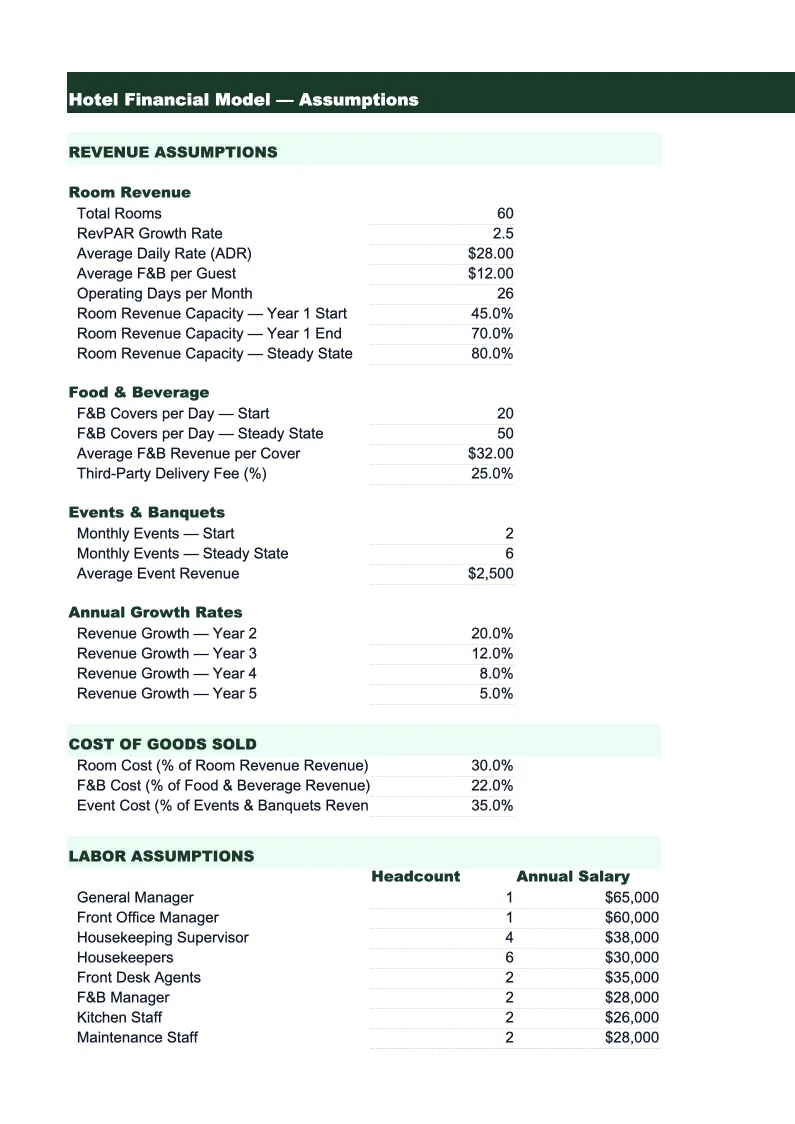
Assumptions
The control center for the entire model.
Revenue Projections
A 24-month revenue build broken out by the revenue centers hotels track separately.
Departmental P&L
A department-by-department contribution margin statement following the Uniform System of Accounts for the Lodging Industry (USALI) structure, which is the standard format that hotel accountants, management companies, franchise systems, and lenders expect.
Labor Plan
A month-by-month labor model broken out by department: Rooms (housekeeping, laundry, room attendants), Front Office (front desk agents, concierge, night audit, reservations), Food & Beverage (cooks, servers, bar staff, banquet staff), Sales & Marketing (sales managers, catering coordinators), and Administration & General (GM, controller, HR).
P&L (USALI)
A full 24-month property-level profit and loss statement structured in USALI format.
Cash Flow
A monthly cash flow statement showing opening cash balance, cash receipts from operations, and cash disbursements for operating expenses, capital expenditures, debt service, and ownership distributions.
KPI Dashboard
A one-page visual summary of the property's performance built around the metrics hotel ownership, operators, and investors track.
Hotel Financial Model Template Features
- ADR and occupancy-based rooms revenue model with segment-level detail (transient, group, contract)
- USALI-format departmental P&L showing rooms, F&B, and undistributed expense contribution margins
- RevPAR and TRevPAR calculations by month with 24-month trend tracking
- GOP% tracker benchmarked against full-service and select-service industry standards
- Debt service coverage ratio (DSCR) calculation for lender and investor reporting
- KPI dashboard with occupancy, ADR, RevPAR, GOP%, and TRevPAR in one view
How to Use This Hotel Financial Model Spreadsheet
Start with the Assumptions sheet. Enter your total available rooms, ADR by guest segment (if you have RevPAR data from STR reports, use that to back into an ADR and occupancy split), and projected occupancy rate by month. For existing properties, pull your last 12 months of PMS (property management system) data — ADR and occupancy are the two numbers that drive everything else. If you are modeling an acquisition or new development, use STR competitive set benchmarks for your market and apply a 10–15% discount to comp set ADR for the first year of operations. Once those inputs are in, set your F&B revenue per occupied room based on your outlet mix (a full-service hotel with a restaurant and bar typically generates $25–55 per occupied room in F&B revenue), and your overhead cost assumptions.
With assumptions set, review the Departmental P&L and main P&L sheets. Check your GOP percentage — if you're modeling a full-service property and GOP is below 25%, look at whether your ADR assumption is too conservative or your undistributed expense estimates are too high. Review the Labor Plan sheet and confirm labor as a percentage of total revenue is in a reasonable range for your service level (35–45% for full-service, 25–35% for select-service). The Cash Flow sheet shows your break-even month and DSCR, which are the two numbers any lender or franchisor will ask for first. If DSCR falls below 1.25x in any month, that signals either operating performance needs to improve or the financing structure needs to be reconsidered.
15 minutes from download to your first hotel projection
Download the template, plug in your ADR, occupancy, and cost assumptions, and see your hotel's full financial picture — RevPAR, GOP%, DSCR, and cash position included.
Why Every Hotel Needs a Financial Model
Hotels are among the most capital-intensive businesses to operate, and the financial complexity matches that intensity. Revenue comes from multiple departments — rooms, food and beverage, meetings and events, parking, spa — each with its own cost structure and margin profile. The rooms department typically generates 60–70% of total hotel revenue and carries the highest margin (70–80% departmental contribution), while F&B generates meaningful revenue but often runs at tighter margins (30–55%) due to labor and food cost intensity. Without a model that separates these revenue streams and their associated costs, it's nearly impossible to understand where the property is making money and where management attention is most needed.
The hotel industry runs on a specific set of KPIs that drive every performance conversation. RevPAR (Revenue per Available Room) is the top-line health indicator — it combines occupancy and ADR into a single number that lets you compare your property against competitors regardless of size. GOP% (Gross Operating Profit percentage) is the operating efficiency indicator — it tells you how much of each revenue dollar flows through to the owner after paying for operations. For full-service hotels, 30–40% GOP is the benchmark; select-service properties targeting 35–50% have a structural advantage because they avoid F&B losses and have simpler staffing models. USALI-format financial reporting is the standard across the industry because it separates departmental income from undistributed expenses, making it easy to see which manager is accountable for which number. This model follows that structure throughout.
Hotel Industry at a Glance
Financial templates built for hotels and hospitality businesses — from independent properties to branded franchises. Pre-loaded with room revenue, F&B, and event billing categories.
Revenue Drivers
- Room revenue (ADR × occupancy)
- Food & beverage
- Meeting & event space
- Spa & wellness
- Parking & ancillary fees
Key Cost Categories
- Labor (rooms, F&B, front office)
- Cost of F&B sold
- OTA & marketing commissions
- Utilities & property maintenance
- Franchise & management fees
- Administrative overhead
Typical Margins
Gross: 65-80% · Net: 10-20%
Seasonality
Business hotels peak weekdays and Q1/Q3; leisure properties peak summer and holidays. January is typically slowest for both segments.
Key Performance Indicators
Hotel Financial Model Template FAQ
More Hotel Templates
Hotel Balance Sheet Template for Excel
$29
Hotel Budget Template for Excel
$29
Hotel Business Plan Template for Excel
$39
Hotel Cash Flow Template for Excel
$29
Hotel Expense Tracker Template for Excel
$29
Hotel Income Statement Template for Excel
$29
Hotel Invoice Template for Excel
$29
Hotel KPI Dashboard Template for Excel
$29
Hotel P&L Template for Excel
$29
Hotel Pro Forma Template for Excel
$29
Hotel Project Budget Template for Excel
$29
Hotel Sales Forecast Template for Excel
$29
Hotel Valuation Template for Excel
$29
More Financial Model Templates
Hotel Financial Model Template
$29