Roofing Income Statement Template
Track revenue, job costs, and overhead on one income statement built for roofing contractors — residential re-roofs, repairs, commercial work, and insurance claims included.
What's Inside This Roofing Income Statement Template
This template includes 4 worksheets, each designed for a specific part of your roofing financial workflow:
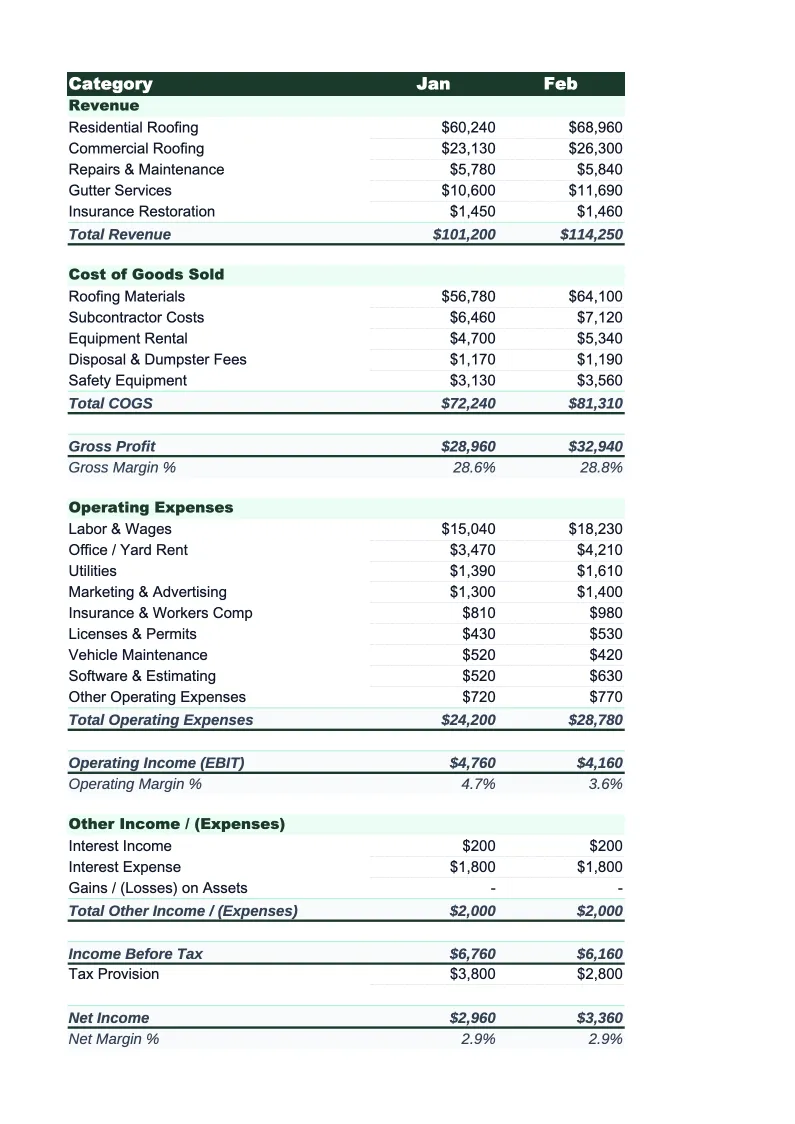
Income Statement
The core monthly income statement structured around how roofing revenue and costs actually flow.
Job Cost Summary
A project-by-project breakdown of revenue and costs for each roofing job.
Annual Summary
A 12-month rollup that pulls revenue, direct job costs, and overhead from each monthly income statement automatically.
Dashboard
Pre-built charts and KPI cards that summarize your roofing company's financial performance at a glance.
Roofing Income Statement Template Features
- Revenue split by work type — residential re-roofing, repairs, commercial, gutters, and insurance claims
- Direct job costs broken out by materials, labor, subcontractors, disposal, and permits
- Gross margin per job tracked in the Job Cost Summary sheet
- 12-month annual rollup with seasonal revenue and margin visibility
- Overhead categories pre-loaded for roofing contractors (bonding, vehicles, workers' comp, lead gen)
- Materials cost percentage auto-calculated to track bid accuracy across jobs
How to Use This Roofing Income Statement Spreadsheet
Start by downloading the .xlsx file and opening it in Excel or Google Sheets — no macros or add-ins required. Open the Income Statement sheet and review the pre-loaded categories. Most roofing contractors will recognize these line items immediately; adjust any labels that don't match how your company tracks work. Enter your revenue by job type and your direct job costs for the current month. If you're mid-year, work backwards using your invoices, subcontractor payments, and supplier receipts — most roofing companies can reconstruct the past few months in under an hour if they have their bank statements and QuickBooks export handy.
Move to the Job Cost Summary sheet and add your active and recently closed jobs. For each project, enter the contract value, your estimated costs by category, and actual costs to date. Update this sheet weekly during active production months — catching a materials overage or a subcontractor bill that exceeds the estimate in week one is much easier to address than discovering it at closeout. For insurance claim jobs especially, track any supplement approvals as separate revenue entries so your job-level margin reflects the final approved scope, not just the initial estimate.
15 minutes from download to your first income statement
Download the template, enter your job revenue and costs, and get a clear picture of your roofing company's gross margin, overhead, and net income.
Why Every Roofing Contractor Needs an Income Statement Template
Roofing contractors typically see gross margins between 25% and 40%, but net margins of only 6–15% — and the gap is almost entirely overhead. Vehicles, insurance (liability and workers' comp premiums in roofing are among the highest of any trade), bonding, crew supervision, and the cost of running an estimating and sales operation consume most of what looks like healthy job-level gross profit. Without an income statement that separates direct job costs from overhead, it's easy to mistake a good gross margin for a good business while overhead quietly eats the bottom line.
A proper roofing income statement structures revenue by work type because the margins behave differently. Residential re-roofing is typically the highest volume segment with predictable material costs and well-established crew productivity rates. Repair work carries higher margins per dollar but smaller job sizes and higher scheduling overhead. Commercial work involves longer sales cycles and larger contracts, often with retainage. Insurance claim jobs can be highly profitable when supplements are managed well, but they also carry the highest administrative burden. Tracking revenue by segment lets you see which mix is actually driving your profitability, not just your top line.
Roofing Industry at a Glance
Financial templates built for roofing contractors — from owner-operators running residential crews to multi-crew companies handling commercial projects. Pre-loaded with materials, labor, and job-cost categories specific to the roofing industry.
Revenue Drivers
- Residential re-roofing (full replacements)
- Roof repairs and patching
- Commercial roofing projects
- Gutter installation and repair
- Insurance claim work
- Emergency repairs
Key Cost Categories
- Roofing materials (shingles, underlayment, flashing)
- Subcontractor and crew labor
- Disposal and dumpster rental
- Permit fees
- Equipment and tools
- Insurance (liability, workers comp)
- Vehicle and transportation
- Overhead and office costs
Typical Margins
Gross: 25-40% · Net: 6-15%
Seasonality
Peak season runs spring through early fall (April–October); storm events drive unpredictable surges year-round. November through March is the slow season in northern markets, though southern markets work year-round.
Key Performance Indicators
Roofing Income Statement Template FAQ
More Roofing Templates
Roofing Balance Sheet Template for Excel
$29
Roofing Budget Template for Excel
$29
Roofing Business Plan Template for Excel
$39
Roofing Cash Flow Template for Excel
$29
Roofing Expense Tracker Template for Excel
$29
Roofing Financial Model Template for Excel
$29
Roofing Invoice Template for Excel
$29
Roofing KPI Dashboard Template for Excel
$29
Roofing P&L Template for Excel
$29
Roofing Pro Forma Template for Excel
$29
Roofing Project Budget Template for Excel
$29
Roofing Sales Forecast Template for Excel
$29
Roofing Business Valuation Template for Excel
$29
More Income Statement Templates
Accounting Firm Income Statement Template for Excel
$29
Auto Repair Income Statement Template for Excel
$29
Car Wash Income Statement Template for Excel
$29
Church Income Statement Template for Excel
$29
Cleaning Service Income Statement Template for Excel
$29
Coffee Shop Income Statement Template for Excel
$29
Roofing Income Statement Template
$29