Roofing P&L Template
Track your roofing company's revenue, materials costs, labor, and net profit with a P&L built around how roofing contractors actually manage their financials — job by job and month by month.
What's Inside This Roofing P&L Template
This template includes 4 worksheets, each designed for a specific part of your roofing financial workflow:
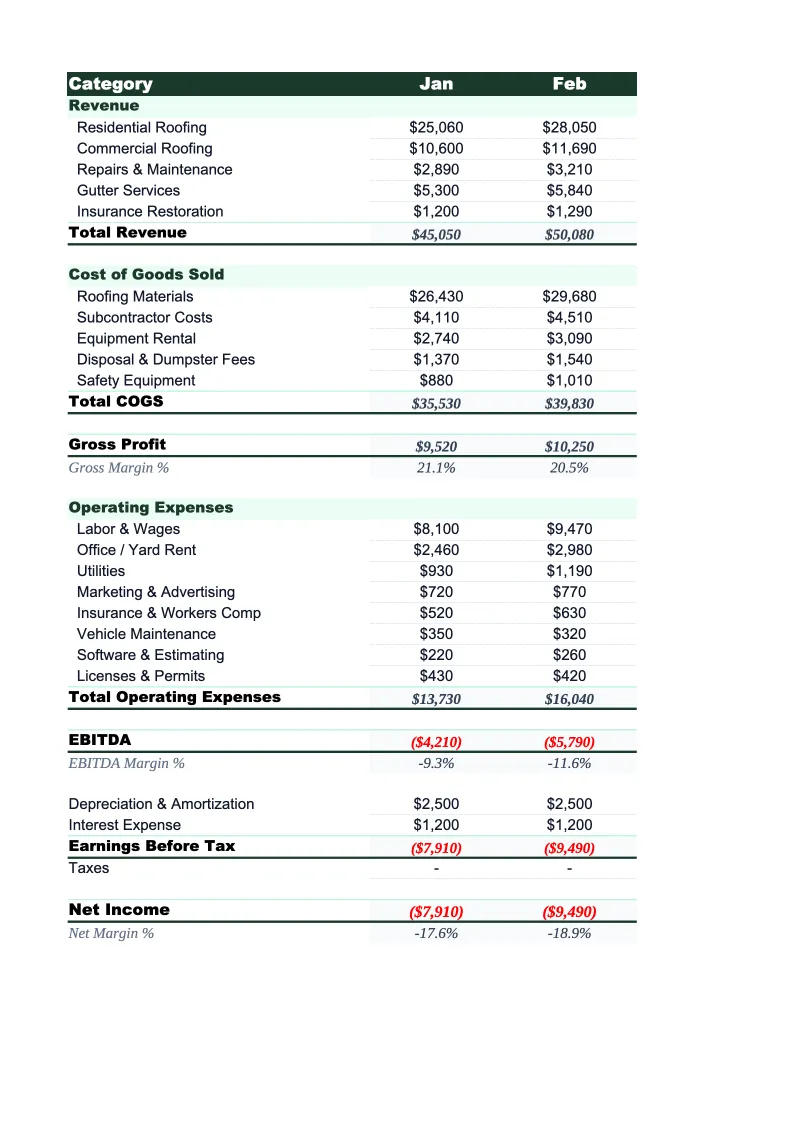
Monthly P&L
The core worksheet for recording each month's revenue and costs.
Annual P&L
A 12-month view that pulls from the Monthly P&L sheet automatically, with no re-entry required.
Job Cost Summary
A project-level breakdown where you enter revenue and direct costs for each roofing job.
Dashboard
A one-page summary with pre-built charts and the key financial metrics that matter for a roofing business.
Roofing P&L Template Features
- Revenue split by job type: residential replacement, commercial, repairs, insurance/storm, and gutters
- Direct costs broken out by materials, labor, subcontractors, equipment rental, and dump fees
- Job Cost Summary sheet with gross margin calculated per roofing project
- 12-month Annual P&L that updates automatically from monthly entries
- Gross margin and net income auto-calculated for every month
- Visual dashboard with margin trends and materials cost percentage charts
How to Use This Roofing P&L Spreadsheet
Download the .xlsx file and open it in Excel or Google Sheets — no macros or setup beyond your own numbers. Start with the Monthly P&L sheet. The revenue categories cover the main job types for roofing contractors: residential replacement, commercial work, repairs and maintenance, insurance and storm damage jobs, and gutters. Review them and rename any line items that don't match how you classify your work. The cost section separates materials, direct labor, subcontractors, equipment rental, and dump fees — the line items that drive roofing gross margin. Most roofing companies find setup takes 15–20 minutes.
Once the structure matches your business, enter your monthly revenue and direct costs from your job cost reports or accounting software. The Job Cost Summary sheet is worth filling out project by project: enter each job's contract value, supplemental amounts, and actual costs, and the sheet calculates gross profit and margin per job automatically. This is the view that tells you whether individual jobs are performing to their estimated margins — information that disappears in the monthly total. Compare your actual materials cost per square against your bid assumptions for a quick read on estimating accuracy.
15 minutes from download to your first P&L
Download the template, enter last month's job revenue and costs, and see your roofing company's gross margin and net income — with a job-by-job cost breakdown included.
Why Every Roofing Company Needs a P&L Template
Roofing companies face a financial structure that punishes vague bookkeeping. Gross margins typically run 25–40% depending on the mix of residential replacement, commercial, and repair work — but net margins land at 5–15% after overhead. Materials and labor move in opposite directions depending on the job type: a residential replacement is materials-heavy (shingles, underlayment, and accessories can run 35–45% of the contract price), while commercial roofing and repairs often have a higher labor component. Without a P&L that separates these cost drivers by job type, it's easy to have one category quietly eroding overall margin without knowing where the leak is.
A roofing P&L needs to reflect how contracts actually vary. Insurance and storm damage jobs often carry different pricing dynamics than retail estimates — supplements can represent 10–20% of the contract value and are worth tracking as a separate revenue line. Commercial roofing has longer payment cycles, different bonding requirements, and a different labor mix than residential work. Repairs and maintenance have high margins but low average ticket sizes, so tracking them separately helps you see their contribution relative to larger replacement jobs. On the cost side, subcontractor costs can represent 20–40% of direct costs on some commercial jobs, and dump and disposal fees add up quickly on multi-layer tear-off projects — both deserve their own lines in the P&L.
Roofing Industry at a Glance
Financial templates built for roofing contractors — from owner-operators running residential crews to multi-crew companies handling commercial projects. Pre-loaded with materials, labor, and job-cost categories specific to the roofing industry.
Revenue Drivers
- Residential re-roofing (full replacements)
- Roof repairs and patching
- Commercial roofing projects
- Gutter installation and repair
- Insurance claim work
- Emergency repairs
Key Cost Categories
- Roofing materials (shingles, underlayment, flashing)
- Subcontractor and crew labor
- Disposal and dumpster rental
- Permit fees
- Equipment and tools
- Insurance (liability, workers comp)
- Vehicle and transportation
- Overhead and office costs
Typical Margins
Gross: 25-40% · Net: 6-15%
Seasonality
Peak season runs spring through early fall (April–October); storm events drive unpredictable surges year-round. November through March is the slow season in northern markets, though southern markets work year-round.
Key Performance Indicators
Roofing P&L Template FAQ
More Roofing Templates
Roofing Balance Sheet Template for Excel
$29
Roofing Budget Template for Excel
$29
Roofing Business Plan Template for Excel
$39
Roofing Cash Flow Template for Excel
$29
Roofing Expense Tracker Template for Excel
$29
Roofing Financial Model Template for Excel
$29
Roofing Income Statement Template for Excel
$29
Roofing Invoice Template for Excel
$29
Roofing KPI Dashboard Template for Excel
$29
Roofing Pro Forma Template for Excel
$29
Roofing Project Budget Template for Excel
$29
Roofing Sales Forecast Template for Excel
$29
Roofing Business Valuation Template for Excel
$29
Roofing P&L Template
$29