Roofing Financial Model Template
Model revenue by job type, track materials and crew costs per project, and project cash flow — built for roofing contractors running residential, commercial, and insurance claim work.
What's Inside This Roofing Financial Model Template
This template includes 8 worksheets, each designed for a specific part of your roofing financial workflow:
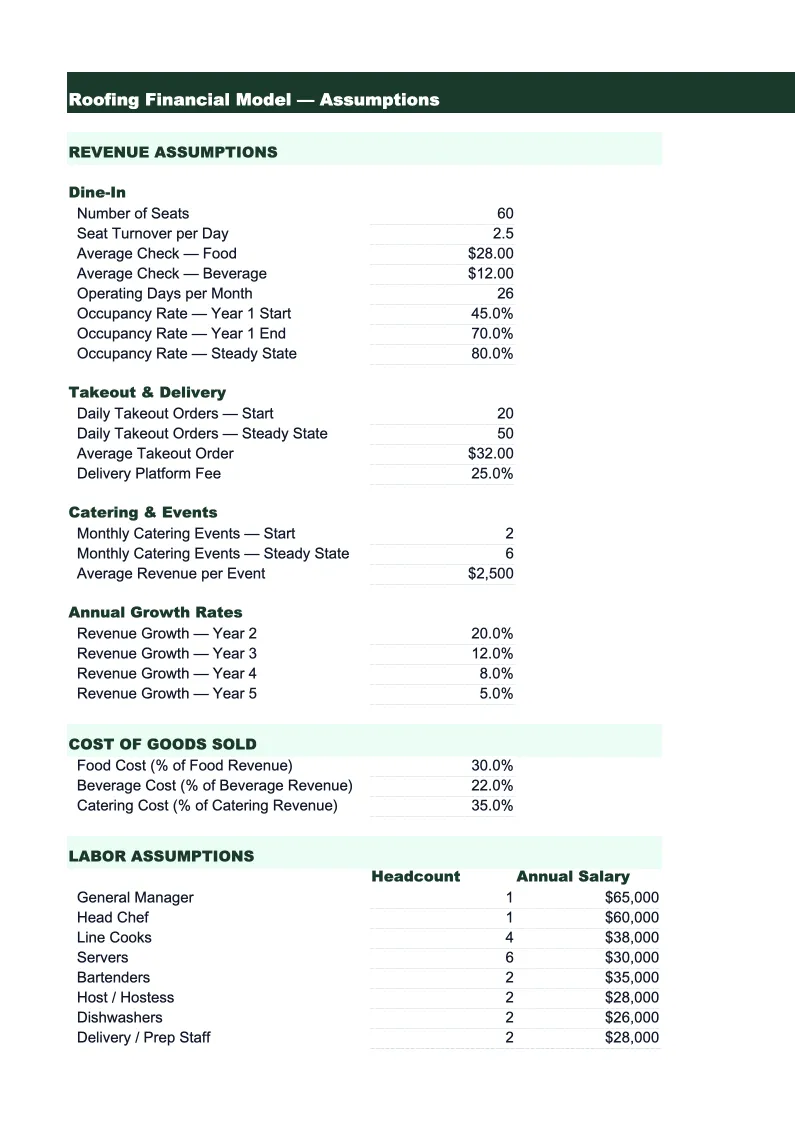
Assumptions
The central control sheet that drives every projection in the model.
Job Costing
A project-level cost tracking sheet for up to 25 simultaneous jobs.
Revenue & Backlog
A 24-month revenue forecast organized by work type — residential re-roofing, storm damage and insurance claims, commercial roofing, repairs and service, and gutter work.
Crew & Labor
A detailed view of field labor capacity and cost.
Overhead & G&A
A monthly breakdown of all indirect costs not charged to individual jobs.
P&L
A 24-month income statement built from all underlying sheets.
Cash Flow
A monthly cash flow statement built around the payment timing realities of roofing work.
KPI Dashboard
A one-page visual summary of the roofing-specific metrics that company owners and their accountants track most closely.
Roofing Financial Model Template Features
- Job-by-job cost tracking with budget vs. actual for materials, labor, disposal, and subcontractors on up to 25 simultaneous jobs
- Insurance claim revenue modeling with separate ACV and RCV payment timing and 45–90 day cycle tracking
- Seasonal revenue multipliers by month with automatic adjustment across all forecast outputs
- Crew capacity model showing fully loaded labor rates including roofing-specific workers' comp and daily production capacity in squares
- Cash flow model built around roofing payment structures — residential deposits, insurance claim cycles, and commercial progress billing
- KPI dashboard with gross margin per job, average job size, close rate, revenue per crew, and job cost variance
How to Use This Roofing Financial Model Spreadsheet
Start with the Assumptions sheet. Set your labor burden rate — workers' comp alone for roofing crews often runs $20–$30 per $100 of wages, so if you're not sure of your fully loaded rate, use 1.5x as a conservative starting point until you can pull the actual number from your payroll reports. Enter your overhead structure using last year's actual numbers as the baseline, your typical job size by work type, and your close rate on estimates. Then fill in the seasonality multipliers based on your market — most northern contractors run 60–70% of average revenue in December through February. With assumptions set, move to the Job Costing sheet and enter your current active jobs with their contract values and initial cost budgets. This first setup takes 45–60 minutes.
Once active jobs are entered, review the Revenue & Backlog sheet. Enter your signed jobs not yet started and your current estimate pipeline by probability. Check the months-of-backlog figure — if it's below 6 weeks, the model is signaling that you need to increase lead generation or estimating activity. Review the Cash Flow sheet closely: roofing cash flow problems are often timing problems, not profitability problems. The cash flow sheet shows months where deposits and ACV insurance payments don't arrive until after you've already committed to crew costs and material purchases. Knowing that gap in advance is what separates contractors who run short and scramble for their line of credit from those who manage it proactively.
15 minutes from download to your first job cost projection
Download the template, enter your active jobs and overhead structure, and see your roofing company's full financial picture — gross margin per job, backlog, and cash position included.
Why Every Roofing Company Needs a Financial Model
Roofing is a high-revenue, high-variable-cost business where the spread between a profitable year and a breakeven year often comes down to job cost accuracy. A roofing company doing $2 million in revenue with 30% gross margin earns $600,000 to cover overhead and profit. The same company with 24% gross margin — the result of a few jobs where material quantities were underestimated, disposal ran over, or crews took longer than bid — earns $480,000. That $120,000 gap is larger than most roofing companies' net profit. The financial model matters in roofing not because the business model is complicated, but because small estimating errors compound across dozens of jobs per year and the only way to catch them is to track actual costs at the job level.
The mix of work types also makes roofing financially distinct from other trades. Residential re-roofing is volume-driven with predictable unit economics. Insurance claim work can have higher average job values and includes supplement income — revenue from additional scope approved by the adjuster after initial estimate — but requires a sales process that involves working with adjusters, and cash collection follows the insurance payment cycle rather than customer payment terms. Commercial roofing has larger contracts, longer payment terms, and often retainage, but provides steadier work through the off-season. A roofing company that tracks revenue and margin by work type understands its own business in a way that one tracking only total monthly revenue cannot. When a storm hits and insurance volume spikes, you need to know whether that work type actually earns the margin its volume suggests.
Roofing Industry at a Glance
Financial templates built for roofing contractors — from owner-operators running residential crews to multi-crew companies handling commercial projects. Pre-loaded with materials, labor, and job-cost categories specific to the roofing industry.
Revenue Drivers
- Residential re-roofing (full replacements)
- Roof repairs and patching
- Commercial roofing projects
- Gutter installation and repair
- Insurance claim work
- Emergency repairs
Key Cost Categories
- Roofing materials (shingles, underlayment, flashing)
- Subcontractor and crew labor
- Disposal and dumpster rental
- Permit fees
- Equipment and tools
- Insurance (liability, workers comp)
- Vehicle and transportation
- Overhead and office costs
Typical Margins
Gross: 25-40% · Net: 6-15%
Seasonality
Peak season runs spring through early fall (April–October); storm events drive unpredictable surges year-round. November through March is the slow season in northern markets, though southern markets work year-round.
Key Performance Indicators
Roofing Financial Model Template FAQ
More Roofing Templates
Roofing Balance Sheet Template for Excel
$29
Roofing Budget Template for Excel
$29
Roofing Business Plan Template for Excel
$39
Roofing Cash Flow Template for Excel
$29
Roofing Expense Tracker Template for Excel
$29
Roofing Income Statement Template for Excel
$29
Roofing Invoice Template for Excel
$29
Roofing KPI Dashboard Template for Excel
$29
Roofing P&L Template for Excel
$29
Roofing Pro Forma Template for Excel
$29
Roofing Project Budget Template for Excel
$29
Roofing Sales Forecast Template for Excel
$29
Roofing Business Valuation Template for Excel
$29
More Financial Model Templates
Roofing Financial Model Template
$29