Roofing KPI Dashboard Template
Track every metric that matters for a roofing contractor — job cost variance, revenue per crew per day, close rate on estimates, and gross margin by project type — in one dashboard that updates as you enter data.
What's Inside This Roofing KPI Dashboard Template
This template includes 6 worksheets, each designed for a specific part of your roofing financial workflow:
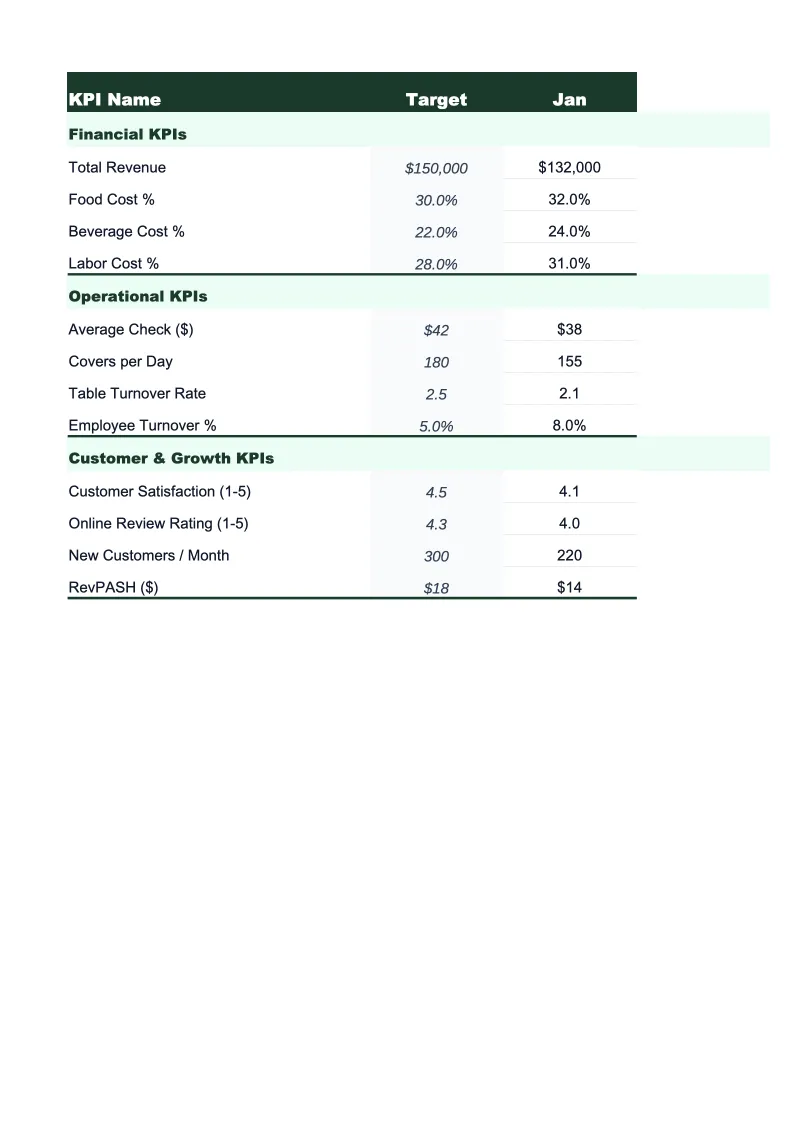
KPI Dashboard
The main overview sheet that displays the most critical roofing business metrics in one view.
Revenue & Job Tracker
Monthly revenue broken down by project type — residential re-roofing (full replacements), roof repairs, commercial roofing, gutter installation, and insurance claim or storm restoration work.
Job Cost Variance
The most operationally valuable sheet in the template for roofing contractors.
Crew Performance
Track each crew's monthly output: jobs completed, revenue generated, total labor hours, and the resulting revenue per crew per day.
Sales & Estimating
Log monthly estimate activity — leads received, estimates written, and jobs won — to calculate your close rate and cost per acquired job.
Monthly Trends
A 12-month rolling view of your core KPIs — total revenue, average job size, gross margin percentage, close rate, and revenue per crew per day — plotted as line charts so you can see the direction of each metric over time.
Roofing KPI Dashboard Features
- Revenue tracking split by project type — residential replacement, repairs, commercial, gutter, and storm/insurance work
- Job cost variance calculated per project with estimated vs. actual materials, labor, and disposal costs
- Revenue per crew per day with individual crew performance breakdowns and callback rate tracking
- Close rate tracking by lead source — referrals, online, canvassing, insurance, and storm
- Color-coded KPI status indicators showing on-target vs. off-target for each core metric
- 12-month trend charts for revenue, gross margin, average job size, and crew productivity
How to Use This Roofing KPI Spreadsheet
Setup takes about 20 minutes. Download the file, open it in Excel or Google Sheets, and start with the Revenue & Job Tracker sheet. Enter last month's revenue and job count by project type — residential replacements, repairs, commercial, gutters, and insurance work. If you're using QuickBooks, pull an income breakdown by job category; if not, your bank deposits or invoice totals work fine for getting started. Then enter last month's crew data in the Crew Performance sheet. The KPI Dashboard pulls from both sheets and populates automatically.
Each month, update the four input sheets: Revenue & Job Tracker, Job Cost Variance, Crew Performance, and Sales & Estimating. Job cost data is the most detailed to pull together — you'll need estimated costs from your original proposals and actual costs from supplier invoices and payroll records. If you run through a project management tool or estimating software (AccuLynx, JobNimbus, Roofr, etc.), most have cost-report exports that match the template's column structure. The monthly update takes 30–45 minutes once you have the data ready.
15 minutes from download to your first KPI snapshot
Download the template, enter last month's numbers, and see your roofing company's job margins, crew productivity, and close rate in one view.
Why Every Roofing Contractor Needs a KPI Dashboard
Most roofing companies run their business by gut feel and bank balance — not by the numbers. Revenue goes up in the spring, the owner gets busy, and by the time October comes, it's hard to know whether the year was actually profitable or just active. The problem is that roofing has two entirely separate profit drivers that don't show up in raw revenue: job cost accuracy and crew efficiency. A company doing $2 million in revenue can have a 35% gross margin or a 20% gross margin depending on how well they estimate materials, manage labor, and run their crews. The gap between those two outcomes is the entire difference between a business that builds equity and one that grinds year after year without accumulating wealth.
The KPIs that matter most for roofing contractors fall into three categories. Job-level profitability: gross margin by project type, average job size, and job cost variance (estimated vs. actual). Most residential re-roofing jobs in competitive markets run 28–38% gross margin; repairs run tighter at 25–35% because mobilization costs are higher relative to job size. Sales efficiency: close rate on estimates, cost per acquired job by lead source, and estimate-to-close cycle time. And crew productivity: revenue per crew per day (a healthy benchmark in residential roofing is $2,500–$4,500 depending on market and project type) and callback rate, which should stay below 3–5% for quality operators.
Roofing Industry at a Glance
Financial templates built for roofing contractors — from owner-operators running residential crews to multi-crew companies handling commercial projects. Pre-loaded with materials, labor, and job-cost categories specific to the roofing industry.
Revenue Drivers
- Residential re-roofing (full replacements)
- Roof repairs and patching
- Commercial roofing projects
- Gutter installation and repair
- Insurance claim work
- Emergency repairs
Key Cost Categories
- Roofing materials (shingles, underlayment, flashing)
- Subcontractor and crew labor
- Disposal and dumpster rental
- Permit fees
- Equipment and tools
- Insurance (liability, workers comp)
- Vehicle and transportation
- Overhead and office costs
Typical Margins
Gross: 25-40% · Net: 6-15%
Seasonality
Peak season runs spring through early fall (April–October); storm events drive unpredictable surges year-round. November through March is the slow season in northern markets, though southern markets work year-round.
Key Performance Indicators
Roofing KPI Dashboard Template FAQ
More Roofing Templates
Roofing Balance Sheet Template for Excel
$29
Roofing Budget Template for Excel
$29
Roofing Business Plan Template for Excel
$39
Roofing Cash Flow Template for Excel
$29
Roofing Expense Tracker Template for Excel
$29
Roofing Financial Model Template for Excel
$29
Roofing Income Statement Template for Excel
$29
Roofing Invoice Template for Excel
$29
Roofing P&L Template for Excel
$29
Roofing Pro Forma Template for Excel
$29
Roofing Project Budget Template for Excel
$29
Roofing Sales Forecast Template for Excel
$29
Roofing Business Valuation Template for Excel
$29
More KPI Dashboard Templates
Roofing KPI Dashboard Template
$29