Roofing Sales Forecast Template
Project monthly revenue for your roofing company by job type, crew count, and season — with pre-built assumptions for residential, commercial, and repair work.
What's Inside This Roofing Sales Forecast Template
This template includes 7 worksheets, each designed for a specific part of your roofing financial workflow:
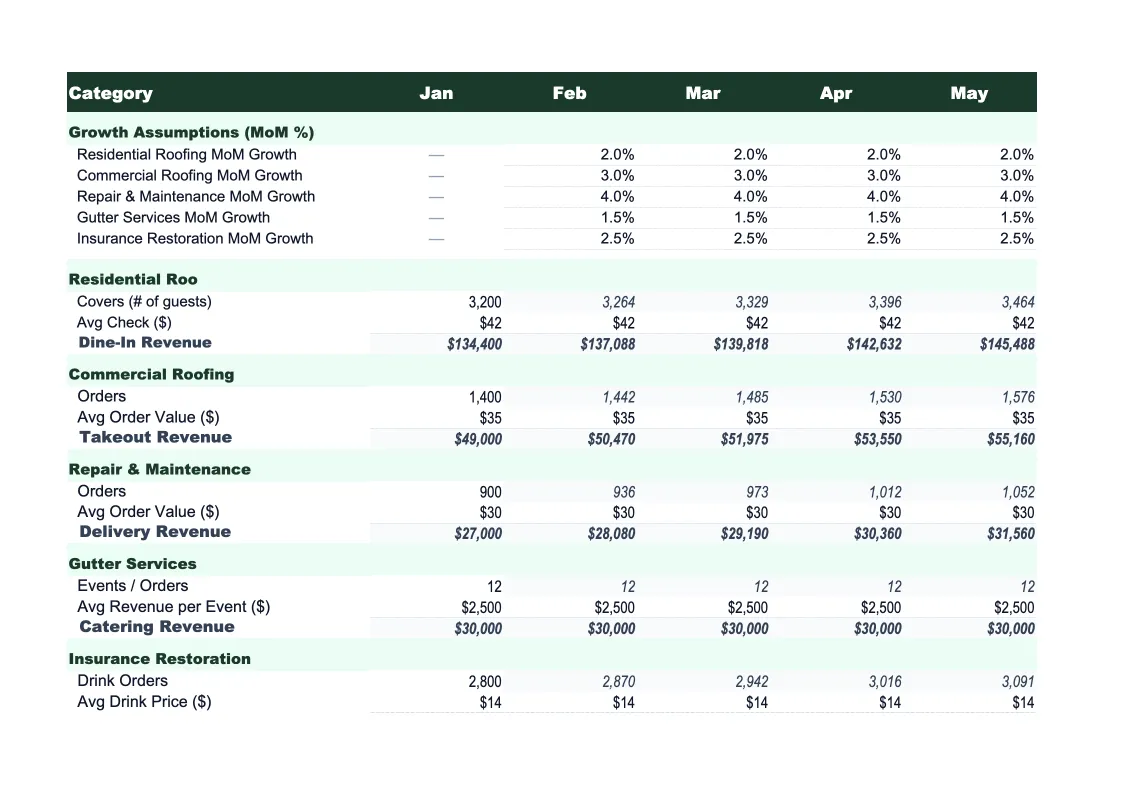
Revenue Assumptions
The driver sheet where you set the inputs that flow through the entire forecast.
Monthly Sales Forecast
A 12-month revenue projection broken down by week and month, drawing directly from your assumptions.
Service Mix Breakdown
A dedicated sheet tracking your revenue by service line: residential re-roofing, roof repairs and patching, commercial projects, gutter installation and repair, and insurance claim work.
Crew Capacity Model
Projects revenue capacity based on crew count, days worked per month, and average jobs per crew per day.
Actual vs Forecast
Track your actual revenue alongside the forecast each month.
Scenario Planner
A side-by-side view of three scenarios — base case, upside, and downside — for your full year.
Dashboard
A one-page visual summary with charts showing monthly revenue trend, service mix by category, forecast vs actual performance, and annual revenue progress against target.
Roofing Sales Forecast Template Features
- Driver-based model: jobs, crew count, close rate, and average job size feed all projections
- Pre-loaded seasonal weights for roofing (spring/summer peak, winter trough)
- Revenue split by service line: re-roofing, repairs, commercial, gutters, insurance
- Crew capacity calculator shows revenue ceiling per crew per month
- Three-scenario planner (base, upside, downside) for annual planning
- Actual vs forecast variance tracking with conditional formatting
How to Use This Roofing Sales Forecast Spreadsheet
Start with the Revenue Assumptions sheet. Enter your average job size for each service type — residential re-roofing is usually your largest ticket, followed by commercial and then repairs. Set your monthly lead volume, close rate on estimates, and number of active crews. These numbers are the foundation for everything else, so take 15 minutes to be realistic here. If you've been in business for a few years, use last year's actual job count and revenue per job as your starting point.
Once your assumptions are set, review the Monthly Sales Forecast and adjust the seasonal weights to match your local market. In the northern US, you might run 40% of your annual revenue in just three months (July, August, September). In the South or Southwest, you may work nearly year-round. The sheet ships with generic roofing seasonality built in — tweak it to reflect your actual experience. Then review the Service Mix Breakdown to see if your projected revenue by job type looks right relative to how you actually operate.
15 minutes from download to your first roofing forecast
Download the template, enter your average job size and crew count, and see a full 12-month revenue projection for your roofing company.
Why Every Roofing Contractor Needs a Sales Forecast
Roofing revenue is lumpy in a way that catches contractors off guard. A storm rolls through, you book six weeks of work in two days, and it feels like a record year — until you realize the pipeline is empty in October. Without a forecast, it's impossible to know whether a slow month is normal seasonality or the start of a real revenue problem. Contractors who forecast their sales know what a normal April looks like, which means they can recognize when they're running 20% behind that baseline and respond before the slow quarter shows up in their bank account.
A good roofing sales forecast breaks revenue into the categories that behave differently from each other. Insurance claim work comes in waves tied to storm events — high margin, hard to predict. Residential re-roofing is your most predictable line if you have a steady lead flow and a consistent close rate. Repairs are lower ticket but higher volume and fill schedule gaps. Commercial jobs are fewer but larger and have longer sales cycles. Each of these has a different average job size, a different lead-to-close timeline, and different seasonality. Mixing them all into a single revenue line hides what's actually driving your growth or your shortfall.
Roofing Industry at a Glance
Financial templates built for roofing contractors — from owner-operators running residential crews to multi-crew companies handling commercial projects. Pre-loaded with materials, labor, and job-cost categories specific to the roofing industry.
Revenue Drivers
- Residential re-roofing (full replacements)
- Roof repairs and patching
- Commercial roofing projects
- Gutter installation and repair
- Insurance claim work
- Emergency repairs
Key Cost Categories
- Roofing materials (shingles, underlayment, flashing)
- Subcontractor and crew labor
- Disposal and dumpster rental
- Permit fees
- Equipment and tools
- Insurance (liability, workers comp)
- Vehicle and transportation
- Overhead and office costs
Typical Margins
Gross: 25-40% · Net: 6-15%
Seasonality
Peak season runs spring through early fall (April–October); storm events drive unpredictable surges year-round. November through March is the slow season in northern markets, though southern markets work year-round.
Key Performance Indicators
Roofing Sales Forecast Template FAQ
More Roofing Templates
Roofing Balance Sheet Template for Excel
$29
Roofing Budget Template for Excel
$29
Roofing Business Plan Template for Excel
$39
Roofing Cash Flow Template for Excel
$29
Roofing Expense Tracker Template for Excel
$29
Roofing Financial Model Template for Excel
$29
Roofing Income Statement Template for Excel
$29
Roofing Invoice Template for Excel
$29
Roofing KPI Dashboard Template for Excel
$29
Roofing P&L Template for Excel
$29
Roofing Pro Forma Template for Excel
$29
Roofing Project Budget Template for Excel
$29
Roofing Business Valuation Template for Excel
$29
More Sales Forecast Templates
Roofing Sales Forecast Template
$29