Food Truck KPI Dashboard Template
Track revenue per service day, food cost percentage, average ticket size, commissary fees, and the other metrics that determine whether your food truck is actually making money.
What's Inside This Food Truck KPI Dashboard Template
This template includes 5 worksheets, each designed for a specific part of your food truck financial workflow:
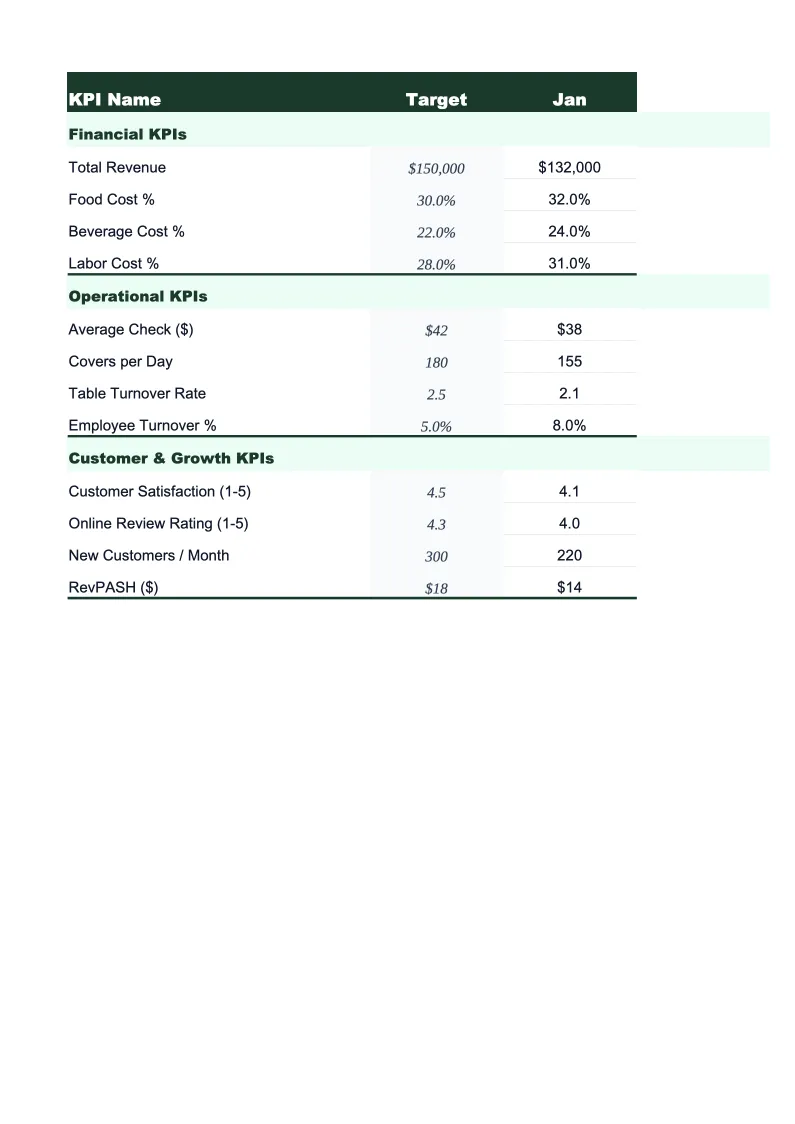
KPI Dashboard
The main visual overview showing your food truck's critical performance metrics at a glance.
Daily Service Log
A structured log for recording each service day's performance — whether it's a regular street stop, a catering event, or a festival.
Monthly Scorecard
Set your targets for the month, then enter actuals as the period progresses.
Location Performance
A worksheet for comparing performance across all the stops, spots, and events in your rotation.
12-Month Trends
A rolling 12-month view of your most important KPIs plotted as line charts.
Food Truck KPI Dashboard Features
- 18 pre-loaded food truck KPIs including revenue per service day and commissary cost %
- Daily service log with per-stop revenue, transaction count, and food cost tracking
- Location performance ranker — sorts stops by revenue per hour and average ticket
- Color-coded status indicators — green/yellow/red against your set monthly targets
- 12-month trend charts for food cost %, revenue per day, and average ticket size
- Event vs. street revenue split tracked automatically each month
How to Use This Food Truck KPI Spreadsheet
Start with the Monthly Scorecard tab and set your targets for the period. If you're just getting started, use the benchmark ranges already built into the template — food cost percentage defaults to 28–35%, commissary fees to 10–15% of revenue, and net profit per service day to a range that reflects typical food truck margins. Adjust any target that doesn't match your operation. The whole setup takes about 10 minutes and you only need to revisit it when your cost structure changes.
Log each service day in the Daily Service Log before you call it a night. Enter your location, service type, gross revenue, transaction count, food cost for the day, and fuel. It takes about two minutes if you have your POS report or cash drawer total in front of you. The formulas calculate your food cost percentage, average ticket, and net profit per day automatically and feed everything into the monthly scorecard. The location and service type fields also populate the Location Performance sheet, so your stop rankings build up over the month without any extra work.
15 minutes from download to your first KPI review
Download the template, enter your targets, and start tracking the metrics that actually determine whether your food truck is profitable.
Why Every Food Truck Needs a KPI Dashboard
Food trucks operate on thin margins — typically 6–15% net — which means a bad week of food costs or three rained-out service days can flip a profitable month into a loss. The problem most operators face isn't that the numbers are hard to understand; it's that they never see them until it's too late to do anything. A KPI dashboard solves this by surfacing food cost percentage, commissary fees, and revenue per service day on a daily and weekly basis, while you can still adjust ordering, add a catering event, or cut a slow stop from the rotation.
The metrics that drive food truck profitability fall into three groups. Revenue metrics — revenue per service day, transactions per day, and average ticket size — tell you whether your menu pricing and location choices are working. Cost metrics — food cost percentage (target 28–35%), commissary fees (typically 10–15% of revenue), and fuel cost per service day — are the main variables you can control. And throughput metrics — service days per month, event vs. street revenue split, and revenue per service hour by location — tell you whether you're deploying the truck where it earns the most. Most food truck operators watch total monthly revenue closely but don't break it down this way, which is why they're often surprised when a busy month turns out to be barely profitable.
Food Truck Industry at a Glance
Financial templates built for food truck operators — from single-unit street vendors to multi-truck fleets. Pre-loaded with commissary fees, fuel costs, permit categories, and event-based revenue tracking.
Revenue Drivers
- Street service (lunch/dinner stops)
- Private catering events
- Corporate events
- Food truck rallies and festivals
Key Cost Categories
- Food costs (COGS)
- Commissary kitchen fees
- Fuel and vehicle maintenance
- Permits and licenses
- Labor
- Payment processing and POS fees
Typical Margins
Gross: 60-70% · Net: 6-15%
Seasonality
Peak revenue in spring and summer; heavily weather-dependent. Winter months significantly slower in northern climates. Event catering provides revenue stability year-round.
Key Performance Indicators
Food Truck KPI Dashboard FAQ
More Food Truck Templates
Food Truck Balance Sheet Template for Excel
$29
Food Truck Budget Template for Excel
$29
Food Truck Business Plan Template for Excel
$39
Food Truck Cash Flow Template for Excel
$29
Food Truck Expense Tracker Template for Excel
$29
Food Truck Financial Model Template for Excel
$29
Food Truck Income Statement Template for Excel
$29
Food Truck Invoice Template for Excel
$29
Food Truck P&L Template for Excel
$29
Food Truck Pro Forma Template for Excel
$29
Food Truck Project Budget Template for Excel
$29
Food Truck Sales Forecast Template for Excel
$29
Food Truck Valuation Template for Excel
$29
More KPI Dashboard Templates
Food Truck KPI Dashboard Template
$29