Food Truck Sales Forecast Template
Project your food truck's revenue by service days, average ticket, and channel — street service, catering, and events broken out separately with seasonal adjustments and actual vs forecast tracking.
What's Inside This Food Truck Sales Forecast Template
This template includes 6 worksheets, each designed for a specific part of your food truck financial workflow:
Assumptions
The foundation of your entire forecast.
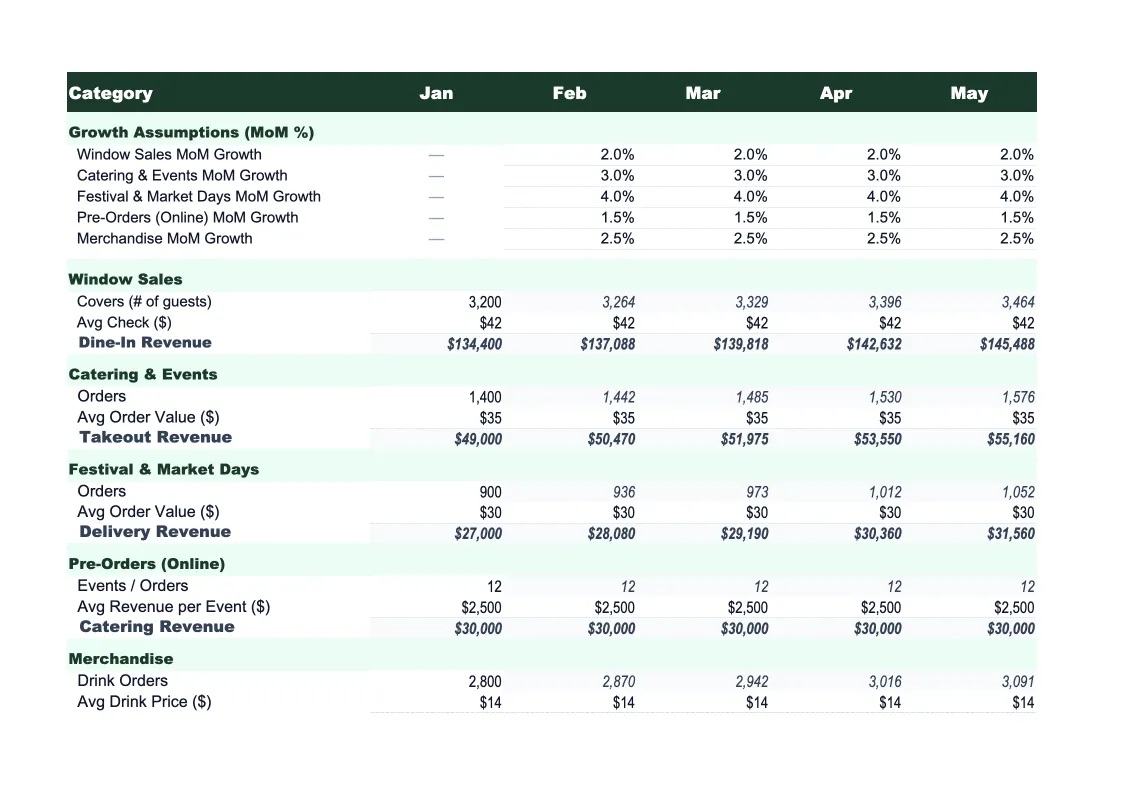
Monthly Forecast
The core projection sheet, showing 12 months of projected revenue broken down by channel — street service (broken into lunch and dinner stops if applicable), private catering, corporate catering, and food truck festivals or rally events.
Annual Summary
A full-year rollup showing projected revenue by channel for each month and in total.
Actual vs Forecast
Enter your actual monthly revenue by channel alongside your projections and the sheet calculates dollar and percentage variance for each line.
Scenario Comparison
Three side-by-side forecasts — base case, upside, and downside — built from different assumption sets.
Dashboard
A visual summary of your forecast with pre-built charts: monthly revenue by channel (stacked bar), actual vs forecast trend line, revenue mix by channel (pie chart showing street vs catering vs events split), and average ticket trend over the forecast period.
Food Truck Sales Forecast Template Features
- Driver-based model: service days × transactions × average ticket by channel
- Revenue split across street service, catering, and events/festivals
- Monthly seasonal adjustment factors for weather and peak season
- Three-scenario comparison (base, upside, downside)
- Actual vs forecast tracker with variance calculations
- Visual dashboard with channel mix and monthly trend charts
How to Use This Food Truck Sales Forecast Spreadsheet
Start with the Assumptions sheet. Enter how many days per week you plan to run each channel — street stops, private catering, and events — along with your expected transactions per service day and average ticket size. For catering, enter a flat average booking value and how many events per month you expect rather than a per-transaction model. If you have a few months of Square or Toast reports, use those actuals as your baseline. Most food truck operators finish the initial setup in 20–30 minutes and need a second pass once the monthly projections feel realistic.
Once your assumptions are in, open the Monthly Forecast sheet and review whether the projections look right month by month. Apply seasonal adjustment factors in the rows provided — lower them for January through March in northern climates, push them above 1.0 for May through August peak season, and add a catering bump for November and December when holiday corporate events pick up. Fill out the Scenario Comparison sheet early: a downside that assumes two weeks of weather-related cancellations per month and no catering in January is a useful stress test before you commit to a commissary lease or equipment loan.
15 minutes from download to your first revenue forecast
Download the template, plug in your service days and average ticket, and see your food truck's projected revenue — month by month, channel by channel.
Why Every Food Truck Needs a Sales Forecast Template
Food truck revenue is more variable than restaurant revenue because the business moves — literally. A bad weather week wipes out street service entirely, a festival booking can double a month's income, and a corporate catering contract can provide more revenue in one afternoon than three days of street stops. Most food truck operators track total sales in their payment processor but never break down what's coming from which channel, which makes it nearly impossible to plan ahead or understand what's actually driving a good or bad month.
The key to forecasting food truck revenue accurately is treating each channel as a separate business. Street service revenue is driven by service days × average transactions × average ticket, with weather and location as the main variables. Catering is a pipeline problem — how many inquiries, what's your close rate, and what's the average booking value. Events and festivals are more predictable (you know the date and expected attendance) but capacity-constrained by your truck's throughput. A forecast that mixes all three into a single revenue line tells you nothing useful when you're deciding whether to take on a new commissary shift or add a second service stop.
Food Truck Industry at a Glance
Financial templates built for food truck operators — from single-unit street vendors to multi-truck fleets. Pre-loaded with commissary fees, fuel costs, permit categories, and event-based revenue tracking.
Revenue Drivers
- Street service (lunch/dinner stops)
- Private catering events
- Corporate events
- Food truck rallies and festivals
Key Cost Categories
- Food costs (COGS)
- Commissary kitchen fees
- Fuel and vehicle maintenance
- Permits and licenses
- Labor
- Payment processing and POS fees
Typical Margins
Gross: 60-70% · Net: 6-15%
Seasonality
Peak revenue in spring and summer; heavily weather-dependent. Winter months significantly slower in northern climates. Event catering provides revenue stability year-round.
Key Performance Indicators
Food Truck Sales Forecast Template FAQ
More Food Truck Templates
Food Truck Balance Sheet Template for Excel
$29
Food Truck Budget Template for Excel
$29
Food Truck Business Plan Template for Excel
$39
Food Truck Cash Flow Template for Excel
$29
Food Truck Expense Tracker Template for Excel
$29
Food Truck Financial Model Template for Excel
$29
Food Truck Income Statement Template for Excel
$29
Food Truck Invoice Template for Excel
$29
Food Truck KPI Dashboard Template for Excel
$29
Food Truck P&L Template for Excel
$29
Food Truck Pro Forma Template for Excel
$29
Food Truck Project Budget Template for Excel
$29
Food Truck Valuation Template for Excel
$29
More Sales Forecast Templates
Food Truck Sales Forecast Template
$29