Food Truck Financial Model Template
Project revenue by service day and event type, model your commissary, fuel, and labor costs, and see your cash position month by month — built specifically for food truck operators and new truck owners.
What's Inside This Food Truck Financial Model Template
This template includes 7 worksheets, each designed for a specific part of your food truck financial workflow:
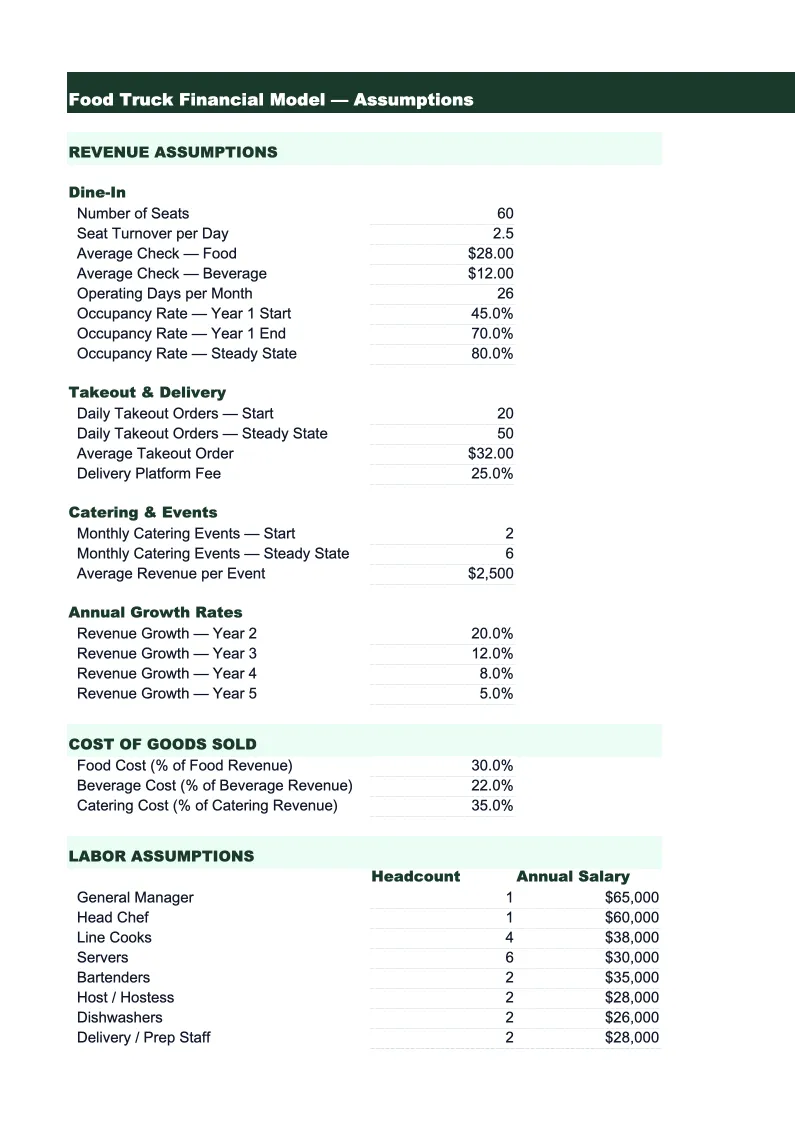
Assumptions
The control panel for the entire model.
Revenue Projections
A 24-month revenue build driven by your service day count and average revenue per day by venue type.
Food Cost
A detailed cost of goods model that tracks food cost by ingredient category: proteins (your biggest variable cost), produce, dairy, dry goods and pantry, sauces and condiments, packaging and disposables (cups, boxes, napkins, utensils — a cost often underestimated), and miscellaneous food costs.
Operating Expenses
A month-by-month breakdown of all non-COGS operating costs specific to food truck operations.
P&L
A 24-month profit and loss statement that consolidates revenue from the Revenue Projections sheet, food cost from the Food Cost sheet, and all operating expenses from the Operating Expenses sheet.
Cash Flow
A monthly cash flow statement showing opening cash balance, operating cash inflows, and all outflows including food cost, operating expenses, and debt service.
Dashboard
A one-page visual summary for internal review, investor meetings, or bank loan applications.
Food Truck Financial Model Template Features
- Service-day revenue model with separate street, catering, and festival projections
- Commissary fee tracking as a standalone cost line — the expense generic templates miss
- Fuel cost calculator that scales automatically with your monthly service day count
- Startup cost schedule for new truck launches: purchase, build-out, permits, and working capital
- 24-month P&L and cash flow with break-even month highlighted
- Food cost breakdown by category: proteins, produce, packaging, and disposables
How to Use This Food Truck Financial Model Spreadsheet
Start with the Assumptions sheet. Enter the number of service days you plan to operate per month, broken out by venue type — your regular street stops, catering bookings, and festival or event appearances. Then enter your average revenue per service day for each venue type. If you're already operating, pull these numbers from your POS or Square reports for the last 30 days. If you're projecting for a new truck, research average daily revenue for trucks in your market (typically $500–$1,500 for street service, $1,500–$5,000 for private catering events) and start conservative. Everything in the model flows from your service day count and daily average, so those two inputs deserve the most attention.
Once assumptions are set, review the Revenue Projections and P&L sheets to check whether the numbers look realistic. The Food Cost sheet will show you whether your food cost percentage is in a healthy range — most food trucks target 28–35%, though higher-end concepts run closer to 38–40%. The Operating Expenses sheet lets you see commissary fees, fuel, and permit costs in context of total revenue. The Cash Flow sheet is where to spend the most time if you are planning a new truck launch: it shows your peak cash requirement before the truck turns cash-flow positive and helps you determine how much startup capital you actually need.
15 minutes from download to your first food truck projection
Download the template, plug in your service days and daily revenue target, and see your food truck's full financial picture — revenue, food cost, cash flow, and break-even month included.
Why Every Food Truck Needs a Financial Model
Food trucks have a financial structure that looks simple on the surface but is harder to model than a traditional restaurant. Revenue comes in unpredictable bursts — a Saturday festival generates more in six hours than three weeks of lunch stops, but the catering calendar is lumpy and hard to forecast. Expenses are a mix of fixed commissary fees that hit every month regardless of how many days you run, and highly variable costs like fuel and food that scale directly with service days. Without a model that separates those dynamics, most operators end up managing cash flow by feel — which works until a slow month and a big repair bill land in the same week.
The financial benchmarks that matter for food trucks are different from brick-and-mortar restaurants. Revenue per service day is the primary performance metric — most successful single-truck operations generate $800–$1,500 on a typical lunch stop and $2,000–$5,000 on a catering or festival day. Food cost percentage should land between 28–35%, similar to a restaurant, but commissary fees add another 8–15% of revenue in operating costs that don't exist in a fixed-location restaurant. That means a food truck needs to hit 50–60% gross margin (after food cost) to cover commissary, fuel, labor, permits, and loan payments and still generate a livable income for the operator. Modeling each of those cost layers separately is the only way to know if your pricing and volume assumptions actually work.
Food Truck Industry at a Glance
Financial templates built for food truck operators — from single-unit street vendors to multi-truck fleets. Pre-loaded with commissary fees, fuel costs, permit categories, and event-based revenue tracking.
Revenue Drivers
- Street service (lunch/dinner stops)
- Private catering events
- Corporate events
- Food truck rallies and festivals
Key Cost Categories
- Food costs (COGS)
- Commissary kitchen fees
- Fuel and vehicle maintenance
- Permits and licenses
- Labor
- Payment processing and POS fees
Typical Margins
Gross: 60-70% · Net: 6-15%
Seasonality
Peak revenue in spring and summer; heavily weather-dependent. Winter months significantly slower in northern climates. Event catering provides revenue stability year-round.
Key Performance Indicators
Food Truck Financial Model Template FAQ
More Food Truck Templates
Food Truck Balance Sheet Template for Excel
$29
Food Truck Budget Template for Excel
$29
Food Truck Business Plan Template for Excel
$39
Food Truck Cash Flow Template for Excel
$29
Food Truck Expense Tracker Template for Excel
$29
Food Truck Income Statement Template for Excel
$29
Food Truck Invoice Template for Excel
$29
Food Truck KPI Dashboard Template for Excel
$29
Food Truck P&L Template for Excel
$29
Food Truck Pro Forma Template for Excel
$29
Food Truck Project Budget Template for Excel
$29
Food Truck Sales Forecast Template for Excel
$29
Food Truck Valuation Template for Excel
$29
More Financial Model Templates
Food Truck Financial Model Template
$29