Retail Sales Forecast Template
Project your store's revenue by product category, sales channel, and season with a forecast template built around how retail businesses actually generate sales.
What's Inside This Retail Sales Forecast Template
This template includes 6 worksheets, each designed for a specific part of your retail financial workflow:
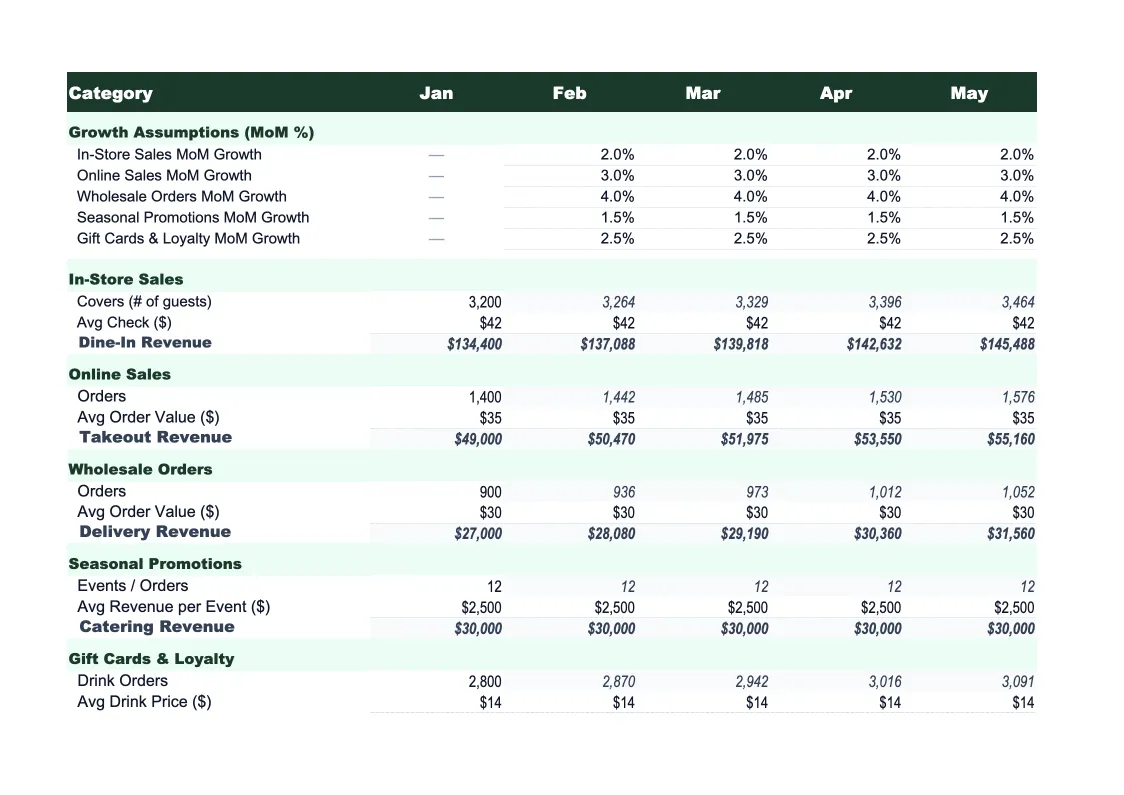
Assumptions & Drivers
The control panel for your entire forecast.
Monthly Sales Forecast
Your 12-month revenue projection broken down by sales channel — in-store, e-commerce, and wholesale — with a monthly total for each.
Category Forecast
A department-level breakdown of projected sales across your product categories.
Seasonality Planner
A dedicated sheet for applying seasonal adjustments and planning promotion periods.
Forecast vs Actual
Track your actual monthly sales against the forecast as the year progresses.
Dashboard
A one-page visual summary with charts and KPIs that update automatically from the other sheets.
Retail Sales Forecast Template Features
- Channel-level projections for in-store, e-commerce, and wholesale
- Product category forecast with sell-through rate and margin by department
- Seasonal index adjustments with a built-in promotion calendar
- Driver-based model: foot traffic, conversion rate, and average transaction value
- Forecast vs actual variance tracking with color-coded alerts
- Visual dashboard with revenue mix, growth rate, and margin KPIs
How to Use This Retail Sales Forecast Spreadsheet
Start with the Assumptions & Drivers sheet. This is where you set the inputs that power the whole model — foot traffic, online session volume, conversion rates, average transaction value by channel, and your seasonal index for each month. If you have 12 months of POS data, use it to set realistic baselines. If you're forecasting for a new store or season, use industry benchmarks as a starting point and adjust as you gather actuals. Most retail operators can complete the Assumptions sheet in 20–30 minutes.
Once your drivers are in place, move to the Category Forecast sheet and map out your product mix. Enter each department or category with its projected unit volume, average selling price, and expected sell-through rate. This step takes the most time, but it's where the forecast earns its value — retail businesses with 8–12 product categories get a much clearer picture of margin contribution by department than they would from a single-line revenue projection. The Monthly Sales Forecast and Dashboard update automatically as you fill in the category data.
15 minutes from download to your first sales projection
Download the template, enter your channel assumptions and product categories, and get a 12-month revenue forecast with seasonality, variance tracking, and a dashboard included.
Why Every Retail Business Needs a Sales Forecast Template
Retail forecasting is harder than it looks because revenue doesn't move in a straight line. A typical retail store does 20–30% of its annual sales in Q4 alone, and that concentration makes flat-line projections nearly useless for planning inventory, staffing, and cash flow. Without a forecast that accounts for seasonality, promotional timing, and product mix, retailers end up either over-ordered on slow-moving inventory or under-stocked when demand spikes — both of which kill margin.
The most useful retail forecasts are built from drivers, not gut feel. That means projecting foot traffic or web sessions, estimating conversion rates, and working out the average transaction value — then multiplying those through to a revenue number. This approach forces clarity on which levers actually move your sales. Is your revenue gap a traffic problem or a conversion problem? Are you growing average order value or just selling more low-margin units? Driver-based forecasts answer those questions because the assumptions are visible and testable rather than buried in a single number.
Retail Industry at a Glance
Financial templates built for retail businesses — from independent boutiques to specialty stores. Pre-loaded with product cost tracking, wholesale invoicing, and retail-specific KPIs.
Revenue Drivers
- In-store sales
- Online/e-commerce sales
- Wholesale orders
- Custom and special orders
Key Cost Categories
- Cost of goods sold
- Labor (sales staff)
- Rent & occupancy
- Inventory shrinkage
- Marketing & advertising
- Shipping & fulfillment
Typical Margins
Gross: 40-60% · Net: 2-6%
Seasonality
Q4 holiday season typically accounts for 20-30% of annual revenue; back-to-school (August) and spring sales are secondary peaks.
Key Performance Indicators
Retail Sales Forecast Template FAQ
More Retail Templates
Retail Balance Sheet Template for Excel
$29
Retail Budget Template for Excel
$29
Retail Business Plan Template for Excel
$39
Retail Cash Flow Template for Excel
$29
Retail Expense Tracker Template for Excel
$29
Retail Financial Model Template for Excel
$29
Retail Income Statement Template for Excel
$29
Retail Invoice Template for Excel
$29
Retail KPI Dashboard Template for Excel
$29
Retail P&L Template for Excel
$29
Retail Pro Forma Template for Excel
$29
Retail Project Budget Template for Excel
$29
Retail Business Valuation Template for Excel
$29
More Sales Forecast Templates
Retail Sales Forecast Template
$29