Retail Pro Forma Template
Project a retail store's revenue by channel, merchandise costs, gross margin, and operating expenses across 5 years — with pre-built formulas for sales per square foot, inventory turnover, shrinkage, and store-level break-even analysis.
What's Inside This Retail Pro Forma Template
This template includes 7 worksheets, each designed for a specific part of your retail financial workflow:
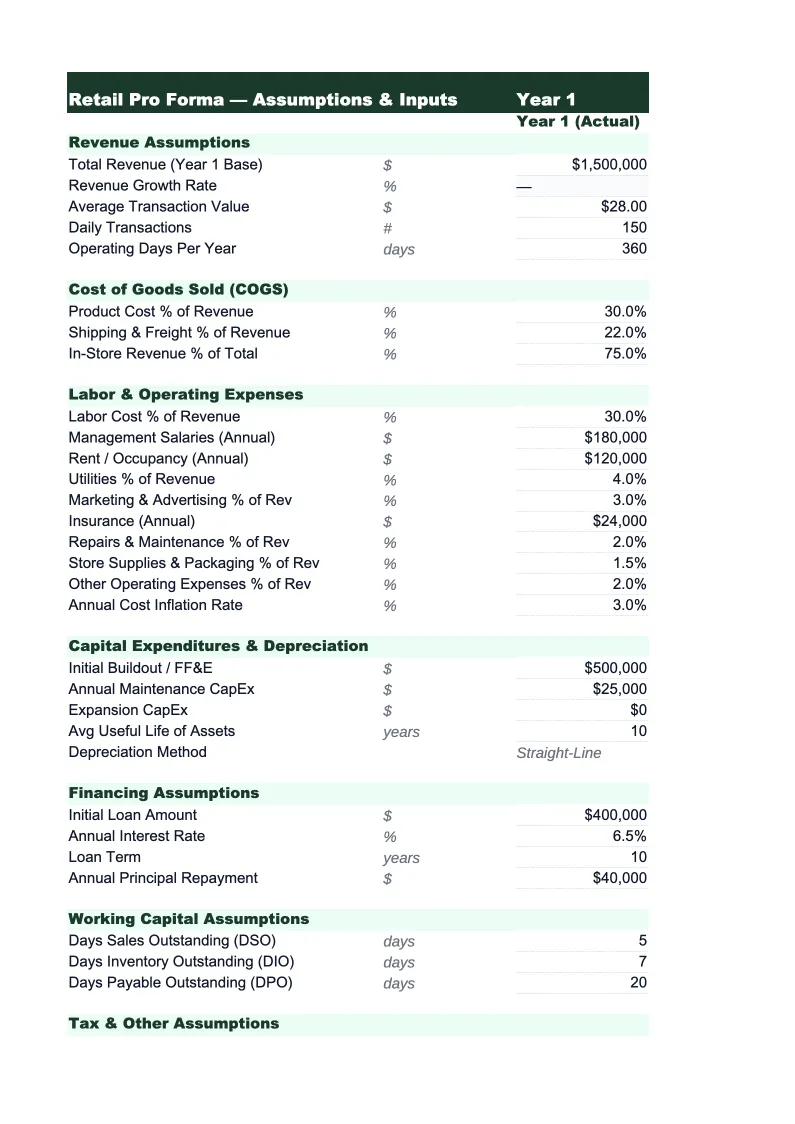
Assumptions
The control panel for the entire model.
Revenue Projections
Projects total retail revenue by month for year one and annually through year five, broken out by sales channel (in-store, e-commerce, wholesale/B2B if applicable) and by product department or category.
COGS & Gross Margin
Models your merchandise cost structure with line items for initial cost of goods, inbound freight and landed costs, vendor rebates and early-payment discounts, planned markdowns (promotional and clearance), and shrinkage (theft, damage, and administrative error).
Operating Expenses
Covers all costs below gross profit: store labor (split by management, full-time associates, and part-time associates, each with their own hourly rate and scheduling assumptions), occupancy (base rent, common area maintenance, property taxes, and percentage-rent clauses that kick in above a sales threshold), marketing and advertising (local spend, digital acquisition, loyalty program costs), store operations (utilities, supplies, loss prevention), technology (POS systems, e-commerce platform, inventory management software), and general and administrative costs (accounting, insurance, legal).
5-Year P&L Summary
An annual summary showing total revenue, total COGS, gross profit, gross margin percentage, total operating expenses, EBITDA, depreciation and amortization, and net income side by side for each of the five projected years.
Cash Flow Projection
A monthly cash flow model for year one and an annual summary through year five, built around the specific cash timing challenges of retail.
Break-Even Analysis
Calculates the monthly and annual sales volume a retail store needs to cover all fixed and variable costs, expressed both as a total revenue figure and as a sales-per-square-foot rate so you can benchmark against industry standards for your retail category.
Retail Pro Forma Template Features
- Revenue model by channel (in-store, e-commerce) and department with seasonal distribution by month
- COGS breakdown with initial margin, planned markdowns, shrinkage, and realized gross margin by category
- Operating expense model separating fixed vs. variable costs with labor scheduling by associate type
- Monthly cash flow with inventory pre-purchase timing and seasonal working capital calculation
- 5-year P&L summary with gross margin, labor-to-sales, occupancy-to-sales, and net margin by year
- Break-even analysis by annual revenue and sales per square foot under variable gross margin scenarios
How to Use This Retail Pro Forma Spreadsheet
Start with the Assumptions sheet. Enter your store's square footage, target revenue per square foot, average transaction value, and expected monthly transaction count — these four inputs drive most of the revenue model. If you're projecting a new store, use your retail category's benchmark sales-per-square-foot as your year-three target and apply a ramp schedule to years one and two (most new retail stores operate at 60–75% of mature-store productivity in their first year). Set your seasonal distribution based on your product category: apparel and gifts weight heavily toward Q4, outdoor and gardening toward Q2–Q3, and home goods tend to be more even with a modest Q4 lift.
Once the Assumptions sheet is set, review the COGS & Gross Margin sheet and adjust the markdown and shrinkage percentages to match your actual or industry-benchmark experience. Initial gross margin for most specialty retailers is 50–60% before markdowns, but realized gross margin after planned promotions, clearance, and shrinkage typically lands 8–15 points lower. Verify these numbers against your own historical data or supplier cost sheets before using the model in any financing conversation. Then move to Operating Expenses and enter your actual or quoted lease rate, your planned staffing model by role type, and your other fixed costs — this is where many retail pro formas are built too optimistically, so use real quotes where you have them.
From download to lender-ready projections in under an hour
Enter your store size, revenue-per-square-foot target, and cost structure — the model builds your 5-year revenue, gross margin, operating expenses, and cash flow analysis automatically.
Why Every Retail Business Needs a Pro Forma
Retail is one of the most margin-sensitive industries to finance because small swings in gross margin have an outsized impact on net income. A specialty retailer running at 48% gross margin and 12% occupancy costs has roughly 36 points of gross profit left to cover labor, marketing, and G&A — leaving perhaps 3–6% net margin in a well-run store. Drop gross margin by 5 points due to higher markdowns or a vendor price increase and net income can disappear entirely. That's the specific problem a retail pro forma is built to address: projecting not just revenue, but the gross margin realization, operating cost structure, and cash timing that determines whether a store is actually viable before you sign a lease.
The financial metrics that define retail health are gross margin (40–60% for specialty retail; 20–30% for grocery; electronics lower), labor as a percentage of sales (10–15% is healthy for most formats), and occupancy as a percentage of sales (8–12% is the typical target; above 15% is a structural problem that's hard to grow out of). Sales per square foot is the single most useful performance metric for comparing locations and benchmarking against competitors — top-performing specialty retailers achieve $500–$800+ per square foot annually; average performers run $250–$400. A retail pro forma that doesn't tie revenue projections to a specific square footage and a credible sales-per-square-foot assumption isn't a financial model — it's a guess.
Retail Industry at a Glance
Financial templates built for retail businesses — from independent boutiques to specialty stores. Pre-loaded with product cost tracking, wholesale invoicing, and retail-specific KPIs.
Revenue Drivers
- In-store sales
- Online/e-commerce sales
- Wholesale orders
- Custom and special orders
Key Cost Categories
- Cost of goods sold
- Labor (sales staff)
- Rent & occupancy
- Inventory shrinkage
- Marketing & advertising
- Shipping & fulfillment
Typical Margins
Gross: 40-60% · Net: 2-6%
Seasonality
Q4 holiday season typically accounts for 20-30% of annual revenue; back-to-school (August) and spring sales are secondary peaks.
Key Performance Indicators
Retail Pro Forma Template FAQ
More Retail Templates
Retail Balance Sheet Template for Excel
$29
Retail Budget Template for Excel
$29
Retail Business Plan Template for Excel
$39
Retail Cash Flow Template for Excel
$29
Retail Expense Tracker Template for Excel
$29
Retail Financial Model Template for Excel
$29
Retail Income Statement Template for Excel
$29
Retail Invoice Template for Excel
$29
Retail KPI Dashboard Template for Excel
$29
Retail P&L Template for Excel
$29
Retail Project Budget Template for Excel
$29
Retail Sales Forecast Template for Excel
$29
Retail Business Valuation Template for Excel
$29
Retail Pro Forma Template
$29