Retail Financial Model Template
Project revenue by channel and traffic, model your inventory costs and gross margin by category, and see your cash position through peak and off-peak seasons — built for independent retailers and multi-location store operators.
What's Inside This Retail Financial Model Template
This template includes 7 worksheets, each designed for a specific part of your retail financial workflow:
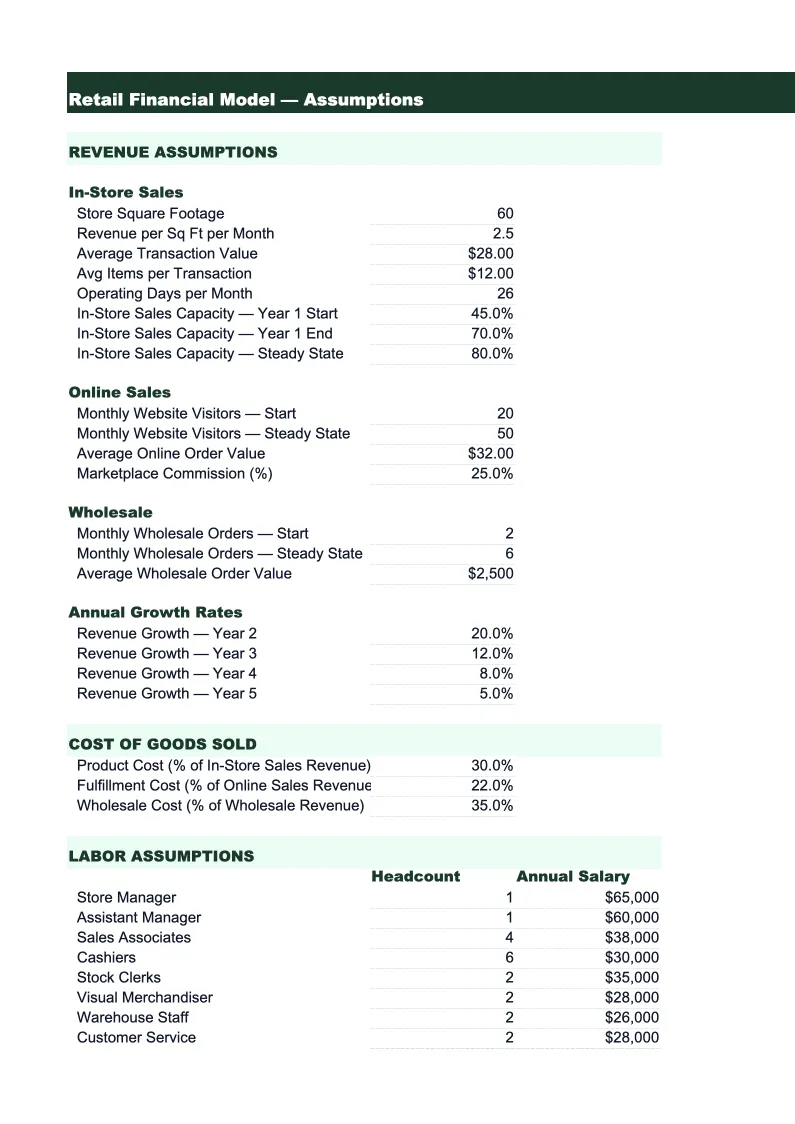
Assumptions
The control panel for the entire model.
Revenue Projections
A 24-month revenue build that separates in-store sales, e-commerce sales, and wholesale orders into distinct lines.
Inventory & COGS
A category-level cost model that calculates cost of goods sold by product department and tracks gross margin for each.
Labor Plan
A monthly labor model that breaks down your staffing by role: full-time sales associates, part-time sales associates, assistant manager, store manager, and any warehouse or fulfillment staff if you run e-commerce operations.
P&L
A 24-month profit and loss statement that pulls revenue from the Revenue Projections sheet, COGS from the Inventory & COGS sheet, and labor from the Labor Plan.
Cash Flow
A monthly cash flow statement showing opening cash balance, cash inflows from sales, and cash outflows for operating expenses, inventory purchases, and any capital expenditures.
Dashboard
A one-page summary of the model's key outputs, designed for owner reviews, investor conversations, or bank presentations.
Retail Financial Model Template Features
- Traffic-and-conversion revenue model with in-store, online, and wholesale channels
- Category-level gross margin tracking with inventory turnover and shrinkage calculations
- Seasonal labor model with Q4 part-time headcount ramp built in
- Inventory purchasing cash flow model showing the timing gap between vendor payment and sales
- Pre-opening cost schedule for new store launches with break-even month projection
- Sales per square foot and average transaction value tracked against retail benchmarks
How to Use This Retail Financial Model Spreadsheet
Start with the Assumptions sheet. Enter your store square footage, estimated daily foot traffic (use your POS system's traffic counter data if you have it, or estimate based on comparable stores in your area), conversion rate, and average transaction value. If you run e-commerce, enter your online traffic estimate and online conversion rate separately — they're usually different from in-store. Set your gross margin targets by product category and your fixed overhead amounts. For a new store, this setup takes about 30 minutes; for an existing store, pull your last three months of POS reports and it goes faster.
Once assumptions are in, review the Revenue Projections and Inventory & COGS sheets. Check that the monthly revenue figures look right given your sales history or market research. Look at the gross margin row on the COGS sheet — if it's above 55% or below 35%, verify your markup percentages are correct, because that's the number investors and lenders will check immediately. The Cash Flow sheet is where most retailers are surprised: look at the months before Q4 and see how much cash you'll need to fund holiday inventory purchasing before the revenue comes in. That gap is the planning number that determines whether you need a line of credit.
15 minutes from download to your first retail projection
Download the template, plug in your traffic, conversion rate, and gross margin targets, and see your store's full financial picture — revenue by channel, inventory cash flow, and break-even month included.
Why Every Retailer Needs a Financial Model
Retail is a business where the numbers look fine on paper until they don't. Gross margins of 40–55% sound healthy, but after labor (12–18% of revenue), rent (5–10%), and all other operating costs, net margins of 2–6% leave almost no room for error. The challenge is that the two biggest cost variables — inventory and labor — are both largely committed before you know how sales will actually go. You buy Q4 inventory in August. You schedule staff for November in October. A financial model that shows you the cash implications of those decisions before you make them is the difference between a well-run retail business and one that runs out of cash in January.
The two metrics that define retail financial health are gross margin and inventory turnover. Gross margin tells you whether your product pricing and mix are generating enough spread over your cost of goods — for specialty retail, 45–55% is typical; for general merchandise, 35–45%. Inventory turnover tells you how efficiently you're converting inventory dollars into sales: a turnover of 4–6 times per year means your inventory sells through every 2–3 months, which is healthy for most categories. When turnover drops — because you overbought, because a trend faded, or because you're sitting on slow-moving SKUs — cash gets trapped in merchandise that isn't moving, and margin gets eroded by the markdowns you eventually have to take to clear it. A model that tracks both metrics monthly by category lets you spot the problem in month two instead of month six.
Retail Industry at a Glance
Financial templates built for retail businesses — from independent boutiques to specialty stores. Pre-loaded with product cost tracking, wholesale invoicing, and retail-specific KPIs.
Revenue Drivers
- In-store sales
- Online/e-commerce sales
- Wholesale orders
- Custom and special orders
Key Cost Categories
- Cost of goods sold
- Labor (sales staff)
- Rent & occupancy
- Inventory shrinkage
- Marketing & advertising
- Shipping & fulfillment
Typical Margins
Gross: 40-60% · Net: 2-6%
Seasonality
Q4 holiday season typically accounts for 20-30% of annual revenue; back-to-school (August) and spring sales are secondary peaks.
Key Performance Indicators
Retail Financial Model Template FAQ
More Retail Templates
Retail Balance Sheet Template for Excel
$29
Retail Budget Template for Excel
$29
Retail Business Plan Template for Excel
$39
Retail Cash Flow Template for Excel
$29
Retail Expense Tracker Template for Excel
$29
Retail Income Statement Template for Excel
$29
Retail Invoice Template for Excel
$29
Retail KPI Dashboard Template for Excel
$29
Retail P&L Template for Excel
$29
Retail Pro Forma Template for Excel
$29
Retail Project Budget Template for Excel
$29
Retail Sales Forecast Template for Excel
$29
Retail Business Valuation Template for Excel
$29
More Financial Model Templates
Retail Financial Model Template
$29