Retail Valuation Template
Value a retail store or chain using seller's discretionary earnings multiples, comparable sales data, and asset-based methods — all in one spreadsheet built for the retail industry.
What's Inside This Retail Valuation Template
This template includes 5 worksheets, each designed for a specific part of your retail financial workflow:
Assumptions
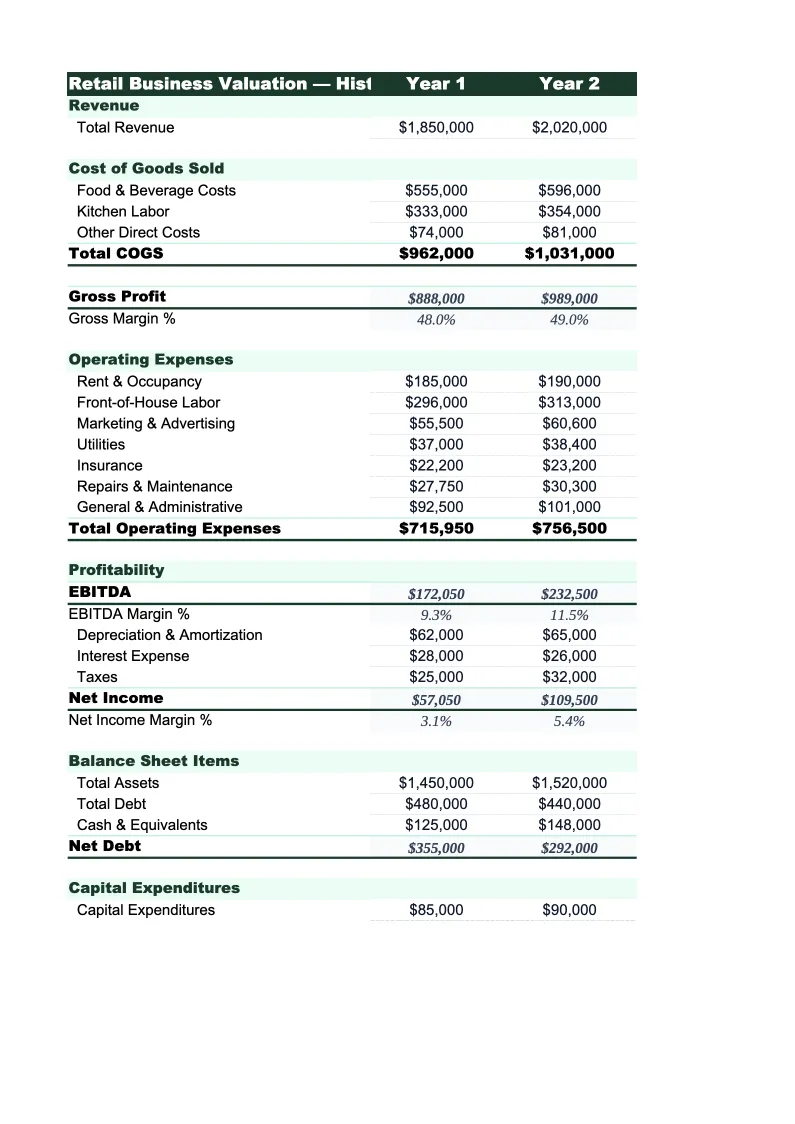
The central input sheet where you enter the financial and operational data that drives all three valuation approaches.
Income Approach
Calculates value based on the store's earning power using two methods.
Market Approach
Values the business by comparing it to actual retail store sales using two metrics: revenue multiple and SDE multiple.
Asset-Based Approach
Estimates the value of the store's tangible and intangible assets minus liabilities.
Valuation Summary
Consolidates all three valuation approaches into a weighted average conclusion.
Retail Valuation Template Features
- SDE and EBITDA multiple methods with retail industry benchmarks
- Comparable sales tracker for up to 8 retail transactions
- Inventory, FF&E, and leasehold improvement asset valuation
- 5-year DCF with terminal value for multi-location analysis
- Weighted average summary with adjustable method weights
- SDE multiple sensitivity table across value scenarios
How to Use This Retail Business Valuation Spreadsheet
Start with the Assumptions sheet. Enter your store's trailing 12-month revenue, gross margin, and operating expenses by category. The most important step is calculating accurate SDE — add back your owner salary, owner benefits (health insurance, vehicle, phone), depreciation, amortization, and any non-recurring expenses like a one-time legal fee or a renovation cost that won't repeat. The sheet guides you through this add-back process line by line. If you're valuing a store you're considering buying, use the financials from the offering memorandum and verify them against tax returns — the SDE figure in a broker listing is often optimistic, so take the time to normalize it yourself.
With your earnings inputs in place, move to the Income Approach sheet and select the SDE multiple that fits your store type and situation. The reference table on that sheet shows typical ranges by retail category — specialty stores with loyal repeat customers and strong gross margins command higher multiples than commodity retailers or stores with heavy online competition. On the Market Approach sheet, enter any comparable sales you can find. Your business broker is the best source for these; if you don't have a broker, BizBuySell's sold listings are a reasonable proxy. On the Asset-Based sheet, enter your inventory at cost and make an estimate of FF&E replacement value.
15 minutes from download to your first retail valuation
Download the template, enter your store's financials, and get a cross-checked valuation using SDE multiples, comparable sales, and asset-based methods — all in one spreadsheet.
How to Value a Retail Business
Retail businesses are valued primarily on their Seller's Discretionary Earnings — the normalized profit available to a full-time owner-operator after all operating expenses and before the owner's compensation. This is different from EBITDA, which assumes professional management; SDE adds back owner salary because most retail buyers are buying a job as well as a business. A store generating $200,000 in SDE selling at a 2.5x multiple implies a $500,000 purchase price — and the buyer expects that business to continue generating that $200,000 annually to recover the purchase price in about five years. The multiple is essentially a proxy for how much risk and confidence the market assigns to the future earnings stream.
Several factors push retail SDE multiples up or down from the 1.5x–3x midmarket range. Multiples expand when the store has a long lease at favorable rent (below 10% of revenue), a loyal customer base with high repeat purchase rates, a proprietary or exclusive product line, strong online sales that supplement the physical location, and consistent revenue growth over multiple years. Multiples compress when the lease is short or above-market, the store faces direct Amazon or big-box competition, inventory turnover is slow (excess dead stock is a liability, not an asset), or the business is heavily dependent on the owner's personal relationships. A store with a well-documented customer file, an active email list, and trained staff who will stay on after the sale can command a meaningfully higher multiple than one where the owner is the business.
Retail Industry at a Glance
Financial templates built for retail businesses — from independent boutiques to specialty stores. Pre-loaded with product cost tracking, wholesale invoicing, and retail-specific KPIs.
Revenue Drivers
- In-store sales
- Online/e-commerce sales
- Wholesale orders
- Custom and special orders
Key Cost Categories
- Cost of goods sold
- Labor (sales staff)
- Rent & occupancy
- Inventory shrinkage
- Marketing & advertising
- Shipping & fulfillment
Typical Margins
Gross: 40-60% · Net: 2-6%
Seasonality
Q4 holiday season typically accounts for 20-30% of annual revenue; back-to-school (August) and spring sales are secondary peaks.
Key Performance Indicators
Retail Business Valuation Template FAQ
More Retail Templates
Retail Balance Sheet Template for Excel
$29
Retail Budget Template for Excel
$29
Retail Business Plan Template for Excel
$39
Retail Cash Flow Template for Excel
$29
Retail Expense Tracker Template for Excel
$29
Retail Financial Model Template for Excel
$29
Retail Income Statement Template for Excel
$29
Retail Invoice Template for Excel
$29
Retail KPI Dashboard Template for Excel
$29
Retail P&L Template for Excel
$29
Retail Pro Forma Template for Excel
$29
Retail Project Budget Template for Excel
$29
Retail Sales Forecast Template for Excel
$29
Retail Valuation Template
$29