Landscaping KPI Dashboard Template
Track revenue per man-hour, job cost variance, maintenance contract retention, and the other metrics that tell you whether your landscaping operation is running efficiently or leaving money on the table.
What's Inside This Landscaping KPI Dashboard Template
This template includes 5 worksheets, each designed for a specific part of your landscaping financial workflow:
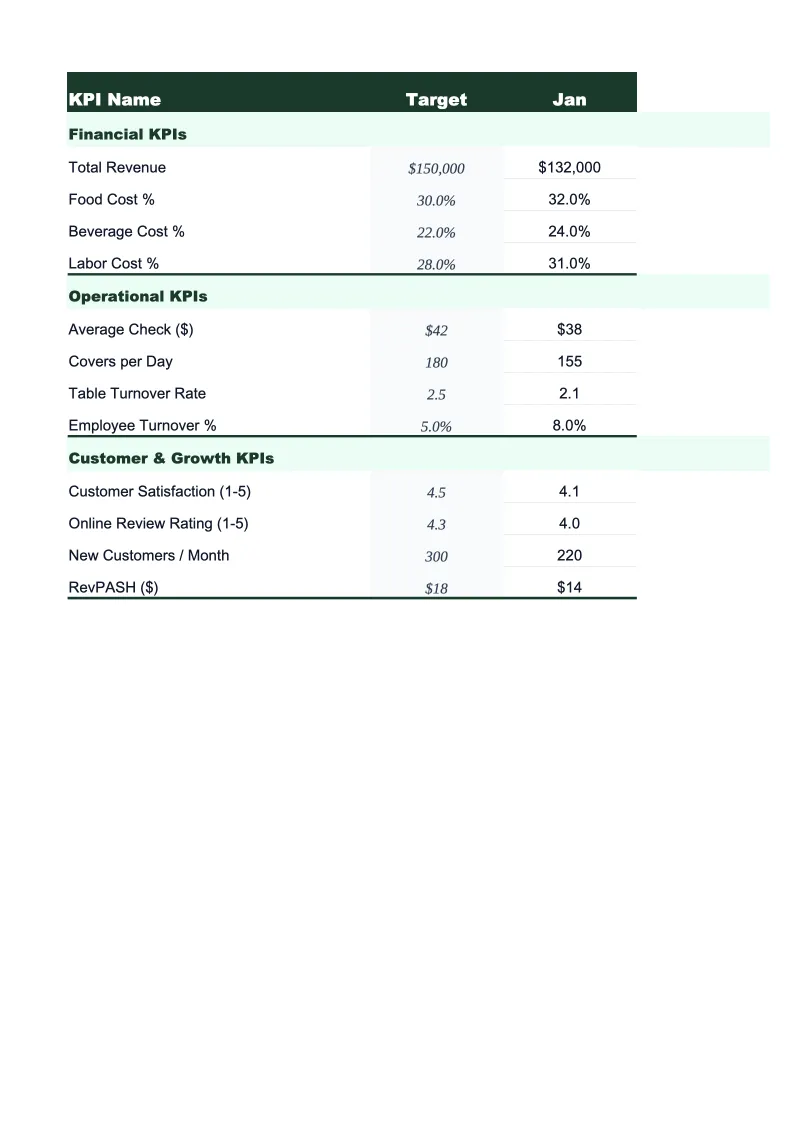
KPI Dashboard
The main visual overview pulling your most important metrics into one screen.
Job Log
A structured log for recording each completed job — maintenance visits, installation projects, hardscaping work, tree service, and snow removal.
Monthly Scorecard
Set your targets for the month, then enter actuals as the period progresses.
Service Mix Analysis
A breakdown of your revenue and margin by service type — recurring maintenance, landscape installation, hardscaping, tree service and irrigation, and snow removal.
12-Month Trends
A rolling 12-month view of your most important KPIs plotted as line charts.
Landscaping KPI Dashboard Features
- 20 pre-loaded landscaping KPIs including revenue per man-hour and job cost variance
- Job log with per-job tracking for labor hours, materials, billings, and gross margin
- Service mix analysis — compares gross margin across maintenance, installation, and hardscaping
- Maintenance contract tracker — retention rate, new contracts, and cancellations per month
- Color-coded status indicators — green/yellow/red against your set monthly targets
- 12-month trend charts for revenue per man-hour, contract count, and gross margin by type
How to Use This Landscaping KPI Spreadsheet
Start with the Monthly Scorecard tab and set your targets before the period begins. If you're not sure what to use, the template includes benchmark ranges based on typical landscaping company performance: revenue per man-hour targets between $50–$70, gross margin targets by service type, and a maintenance retention rate target above 85%. Adjust any target that doesn't reflect your specific market or service mix. Setting the targets takes about 15 minutes and only needs to be revisited when your cost structure or service mix changes meaningfully.
After each job is completed, log it in the Job Log sheet. Enter the job type, crew size, hours worked, materials cost, and the amount billed. The formulas calculate revenue per man-hour, gross margin, and job cost variance automatically. For recurring maintenance routes, you can log the full route as a single entry or break it down by property — either works. The monthly totals feed the Scorecard and Service Mix Analysis tabs automatically, so your dashboard builds itself over the course of the month without any extra aggregation work.
15 minutes from download to your first KPI review
Download the template, set your targets, and start tracking the metrics that determine whether your landscaping operation is actually profitable.
Why Every Landscaping Company Needs a KPI Dashboard
Landscaping companies typically operate at 8–15% net margins, which means inefficiencies in labor deployment or estimating accuracy hit the bottom line fast. The most common problem isn't that owners don't care about the numbers — it's that they're tracking revenue and expenses but not the operational ratios that drive profitability. Revenue per man-hour is the single most important metric for a field-service business: it tells you whether your crews are deployed efficiently, whether your pricing is right, and whether a particular service type is actually worth offering. Without a structured dashboard, most landscape companies only discover a service is underperforming at year-end, when it's too late to adjust.
Three areas drive profitability in landscaping more than anything else. First, job cost variance — the gap between what you estimated a job would cost and what it actually cost in labor and materials. In well-run operations this variance stays within 5–10%; in companies without systematic tracking, it often runs 15–25%, quietly erasing margins on every project. Second, maintenance contract retention — your recurring maintenance base is the most predictable and efficient revenue in the business, because route density keeps labor cost per visit low. A retention rate below 80% means you're spending heavily on sales and onboarding just to stay flat. Third, service mix — not all service types earn the same margin per hour, and shifting the mix toward higher-margin work is the highest-leverage thing most landscape companies can do to improve overall profitability without adding revenue.
Landscaping Industry at a Glance
Financial templates built for landscaping companies — from lawn maintenance crews to full-service landscape design and installation firms. Pre-loaded with service categories, material line items, and project billing structures.
Revenue Drivers
- Recurring maintenance contracts
- Landscape installation projects
- Hardscaping (patios, walls, walkways)
- Tree services and irrigation
- Snow and ice removal
Key Cost Categories
- Plants and nursery materials
- Hardscape materials (pavers, stone, block)
- Crew labor (direct field wages)
- Equipment and vehicle fleet
- Payroll taxes and insurance
- Subcontractors
Typical Margins
Gross: 40-55% · Net: 8-15%
Seasonality
Strongly seasonal in northern markets — peak April through October, near-zero outdoor work in January and February. Year-round operations in southern and Pacific markets.
Key Performance Indicators
Landscaping KPI Dashboard FAQ
More Landscaping Templates
Landscaping Balance Sheet Template for Excel
$29
Landscaping Budget Template for Excel
$29
Landscaping Business Plan Template for Excel
$39
Landscaping Cash Flow Template for Excel
$29
Landscaping Expense Tracker Template for Excel
$29
Landscaping Financial Model Template for Excel
$29
Landscaping Income Statement Template for Excel
$29
Landscaping Invoice Template for Excel
$29
Landscaping P&L Template for Excel
$29
Landscaping Pro Forma Template for Excel
$29
Landscaping Project Budget Template for Excel
$29
Landscaping Sales Forecast Template for Excel
$29
Landscaping Business Valuation Template for Excel
$29
More KPI Dashboard Templates
Landscaping KPI Dashboard Template
$29