Landscaping Sales Forecast Template
Forecast your landscaping company's revenue from recurring maintenance contracts, one-time installation projects, and seasonal service lines — with month-by-month projections, actual vs forecast tracking, and scenario planning built in.
What's Inside This Landscaping Sales Forecast Template
This template includes 7 worksheets, each designed for a specific part of your landscaping financial workflow:
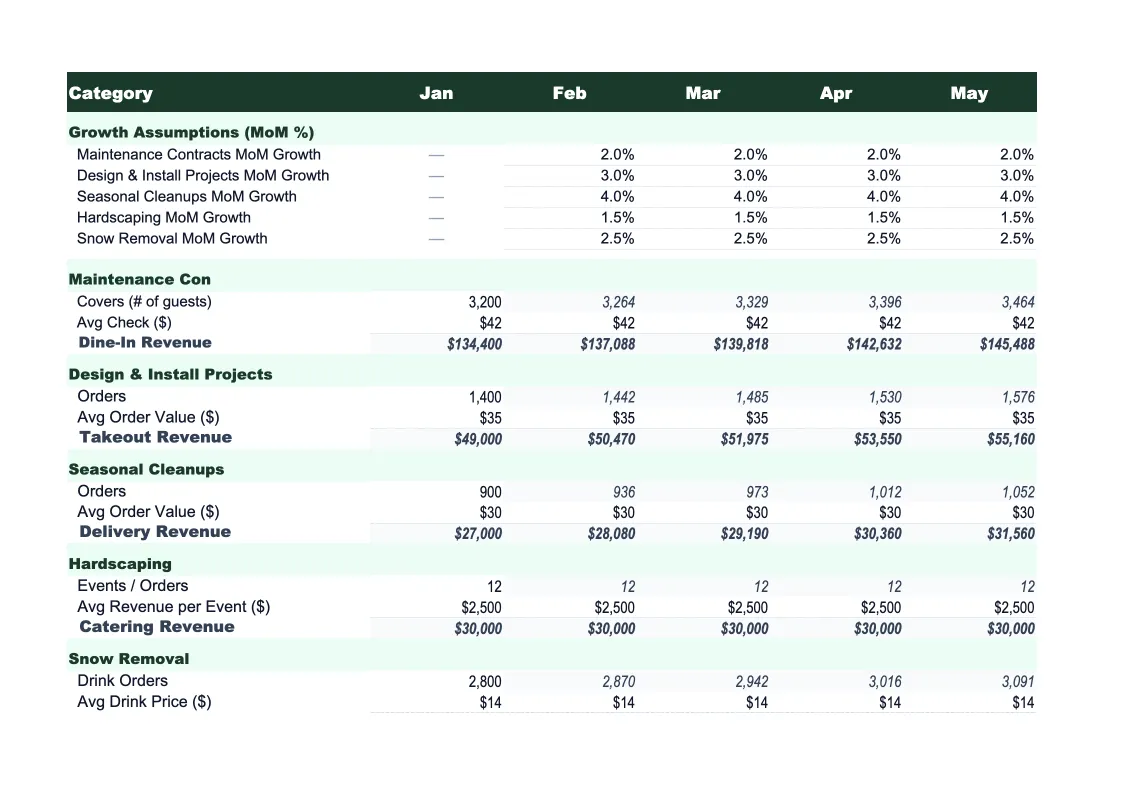
Service Revenue Drivers
The assumptions sheet where you define your core revenue inputs for each service line.
Maintenance Contract Schedule
A running ledger of your recurring maintenance contracts — the most predictable revenue source in a landscaping business.
Project Pipeline
Your bid log for one-time projects: landscape installations, hardscaping (patios, retaining walls, walkways), irrigation system installs, and commercial property contracts.
Monthly Forecast
The full 12-month revenue projection combining three streams: maintenance contract revenue from the Contract Schedule, weighted project revenue from the Project Pipeline, and additional service revenue from the Drivers sheet.
Actual vs Forecast
Enter your actual monthly revenue by service line after each month closes and the sheet calculates variance — both dollar difference and percentage — against your projection.
Scenario Comparison
Three side-by-side revenue scenarios — base, upside, and downside — built from different contract retention rates, project close rates, and seasonal revenue assumptions.
Dashboard
A visual one-page summary of your revenue forecast with pre-built charts: monthly projected revenue by service line (stacked bar showing maintenance vs installation vs other services), contract revenue vs project revenue trend, actual vs forecast variance for the trailing six months, and current pipeline total by project type.
Landscaping Sales Forecast Template Features
- Maintenance contract schedule with seasonal suspension for northern-market operators
- Weighted project pipeline: bid value × close probability by service category
- Revenue split by service line (maintenance, installation, hardscaping, tree services, snow removal)
- Capacity check comparing projected revenue to field crew production hours
- Three-scenario comparison with adjustable retention and close rate assumptions
- Actual vs forecast tracker with rolling close rate and 12-month accuracy score
How to Use This Landscaping Sales Forecast Spreadsheet
Start with the two foundation sheets. First, open the Maintenance Contract Schedule and enter every active recurring contract — client name, service tier, monthly value, and the months the contract runs. For northern-market operators, mark the winter suspension months accurately; contracts that don't run December through February are worth significantly less annually than their monthly rate implies, and getting this right prevents a common mistake where owners overstate their contract book by 20-30%. Then move to the Service Revenue Drivers sheet and fill in your assumptions for project and ancillary revenue — how many installs you expect per month, your average project size, and your close rate. Budget 45 to 60 minutes for this setup depending on how many contracts you're managing.
Once the foundation data is entered, review the Monthly Forecast sheet to check whether the projections look right. Pay attention to your spring ramp (April-May in most northern markets) and your peak summer months — if those projections look too smooth or too aggressive, adjust the seasonality assumptions on the Drivers sheet. Then run the Scenario Comparison: set a downside where you lose 15% of contracts at renewal and your installation close rate drops 10 points. If that downside still covers your fixed overhead — payroll, equipment payments, insurance — your business is in a healthy position. If the downside scenario puts you underwater, that's useful information before you add a new crew truck.
15 minutes from download to your first revenue forecast
Download the template, enter your maintenance contracts and active bids, and see your landscaping company's projected revenue — month by month, service line by service line.
Why Every Landscaping Company Needs a Sales Forecast Template
Landscaping revenue is split between two completely different business models operating under the same roof: recurring maintenance contracts, which behave like subscription revenue with predictable monthly billing and known retention rates; and one-time installation and construction projects, which behave like a contractor's pipeline with lumpy wins and variable timing. Most landscaping owners have a clear sense of one or the other but not both. They know their maintenance book is around $45,000 a month but haven't modeled what the year looks like when six contracts don't renew in March and two large patio projects close later than expected. A sales forecast that separates these two revenue streams and applies different forecasting logic to each gives you visibility that a simple annual revenue target can't provide.
The two metrics that drive forecasting accuracy in landscaping are maintenance contract retention rate and installation close rate. Retention rate measures what percentage of your contract revenue renews each season — healthy operators typically run 85-92%, meaning they replace lost contracts with new ones and grow the book incrementally. A retention rate below 80% is a signal that pricing, service quality, or client communication has a problem that will compound year over year. Installation close rate is how many of your submitted estimates convert to signed contracts — for most residential landscaping companies this runs 25-40%; commercial landscaping bids are more competitive and often closer to 15-25%. Tracking both metrics monthly, rather than just watching total revenue, tells you which lever to pull when revenue misses target.
Landscaping Industry at a Glance
Financial templates built for landscaping companies — from lawn maintenance crews to full-service landscape design and installation firms. Pre-loaded with service categories, material line items, and project billing structures.
Revenue Drivers
- Recurring maintenance contracts
- Landscape installation projects
- Hardscaping (patios, walls, walkways)
- Tree services and irrigation
- Snow and ice removal
Key Cost Categories
- Plants and nursery materials
- Hardscape materials (pavers, stone, block)
- Crew labor (direct field wages)
- Equipment and vehicle fleet
- Payroll taxes and insurance
- Subcontractors
Typical Margins
Gross: 40-55% · Net: 8-15%
Seasonality
Strongly seasonal in northern markets — peak April through October, near-zero outdoor work in January and February. Year-round operations in southern and Pacific markets.
Key Performance Indicators
Landscaping Sales Forecast Template FAQ
More Landscaping Templates
Landscaping Balance Sheet Template for Excel
$29
Landscaping Budget Template for Excel
$29
Landscaping Business Plan Template for Excel
$39
Landscaping Cash Flow Template for Excel
$29
Landscaping Expense Tracker Template for Excel
$29
Landscaping Financial Model Template for Excel
$29
Landscaping Income Statement Template for Excel
$29
Landscaping Invoice Template for Excel
$29
Landscaping KPI Dashboard Template for Excel
$29
Landscaping P&L Template for Excel
$29
Landscaping Pro Forma Template for Excel
$29
Landscaping Project Budget Template for Excel
$29
Landscaping Business Valuation Template for Excel
$29
More Sales Forecast Templates
Landscaping Sales Forecast Template
$29