Landscaping P&L Template
Track your landscaping company's revenue by service type, job costs, crew labor, and materials — with gross margin and net income calculated automatically each month.
What's Inside This Landscaping P&L Template
This template includes 4 worksheets, each designed for a specific part of your landscaping financial workflow:
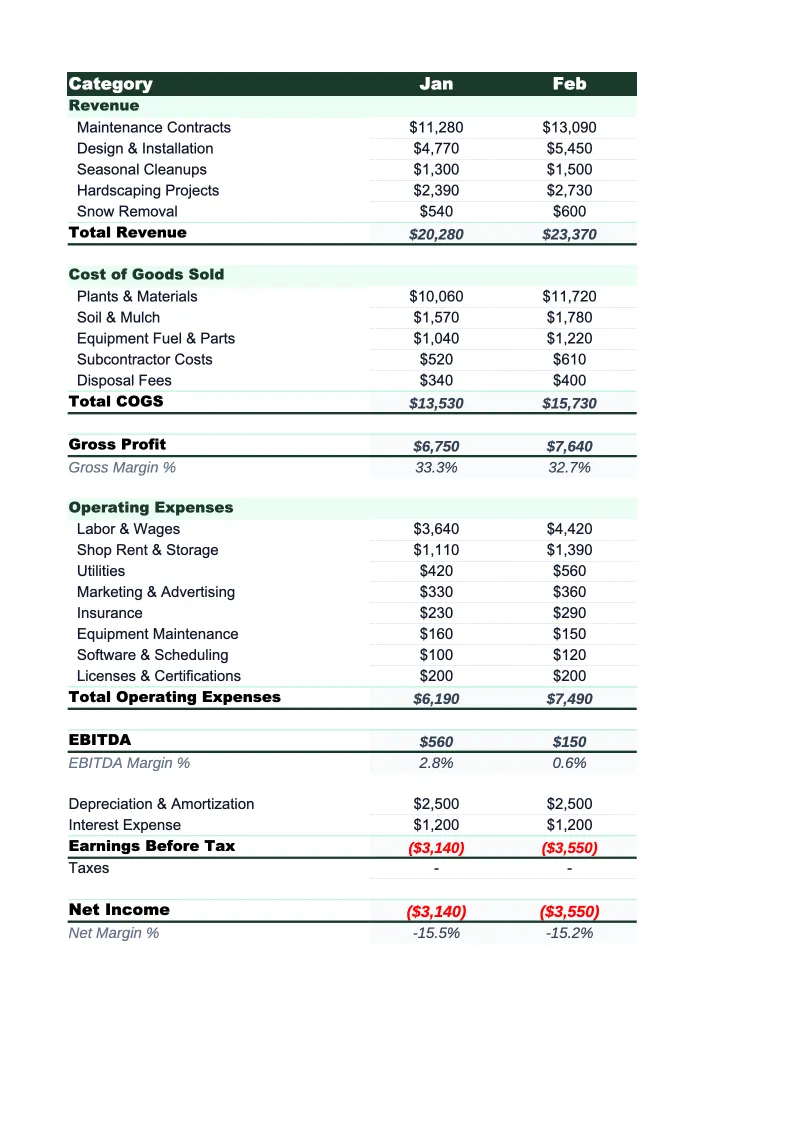
Monthly P&L
The core worksheet where you record each month's revenue and job costs by service line.
Annual P&L
A 12-month rollup that pulls data from the Monthly P&L sheet without any additional entry.
Job Cost Tracker
A worksheet for tracking estimated versus actual job costs on individual projects or contract accounts.
Dashboard
A one-page visual summary showing the financial metrics that matter most to a landscape contractor.
Landscaping P&L Template Features
- Revenue split by service type: maintenance contracts, installation, hardscaping, tree services, snow removal
- COGS broken down by materials, direct crew labor, and subcontractors
- Job cost tracker with estimated vs. actual variance and overage flags
- Gross margin and net income calculated automatically every month
- 12-month annual P&L with full-year totals and seasonal revenue view
- Visual dashboard with gross margin %, labor %, and monthly revenue trends
How to Use This Landscaping P&L Spreadsheet
Download the .xlsx file and open it in Excel or Google Sheets — no macros, no plugins required. Start with the Monthly P&L sheet. The revenue categories are pre-loaded for the five main landscaping service lines: maintenance contracts, installation, hardscaping, tree and irrigation services, and snow removal. Review the expense categories in the same way — most landscape contractors will use 80–90% of the pre-loaded cost lines without changes. Rename any categories that don't apply to your operation and add any that are missing. First-time setup typically takes 15–20 minutes.
Once the structure matches your business, enter your monthly revenue and expense figures. Pull revenue numbers from your invoicing or job management software (LMN, Jobber, or Service Autopilot all export monthly summaries). For expenses, use your bank statements or bookkeeping software. The Job Cost Tracker is worth updating per-project as work closes out — enter your estimated and actual costs for each job and review the variance column to see which job types are running over estimate. This is where most landscape companies find the fastest margin improvements.
15 minutes from download to your first P&L
Download the template, enter last month's numbers, and see your landscaping company's gross margin and net income — broken down by service type and with job cost variance calculated automatically.
Why Every Landscaping Company Needs a P&L Template
Landscaping companies face a financial challenge that most other service businesses don't: strong revenue during a 6–7 month peak season has to carry overhead through 5–6 months of reduced or zero outdoor work. That dynamic makes a P&L not just a reporting tool but a planning requirement. Without knowing your gross margin by service type and your true overhead structure, it's difficult to price maintenance contracts correctly, estimate how much snow removal revenue you actually need in winter, or decide whether to invest in crew expansion heading into spring. Most landscape company owners know their revenue; far fewer know their net margin or how it varies between maintenance and installation work.
A landscaping P&L has specific structure requirements that generic templates don't address. Revenue needs to separate recurring maintenance contracts from project-based installation and hardscaping work — these have different margin profiles, different payment timing, and require different capacity planning. Cost of goods sold should break out plants and materials separately from direct crew labor, because material cost percentage and labor cost percentage are managed differently. Landscaping gross margins typically run 40–55%, but the mix matters: maintenance contracts often run higher gross margins than one-time installations, and hardscaping margins depend heavily on material sourcing and subcontractor management. This template organizes all of those elements so you can see the margin story clearly.
Landscaping Industry at a Glance
Financial templates built for landscaping companies — from lawn maintenance crews to full-service landscape design and installation firms. Pre-loaded with service categories, material line items, and project billing structures.
Revenue Drivers
- Recurring maintenance contracts
- Landscape installation projects
- Hardscaping (patios, walls, walkways)
- Tree services and irrigation
- Snow and ice removal
Key Cost Categories
- Plants and nursery materials
- Hardscape materials (pavers, stone, block)
- Crew labor (direct field wages)
- Equipment and vehicle fleet
- Payroll taxes and insurance
- Subcontractors
Typical Margins
Gross: 40-55% · Net: 8-15%
Seasonality
Strongly seasonal in northern markets — peak April through October, near-zero outdoor work in January and February. Year-round operations in southern and Pacific markets.
Key Performance Indicators
Landscaping P&L Template FAQ
More Landscaping Templates
Landscaping Balance Sheet Template for Excel
$29
Landscaping Budget Template for Excel
$29
Landscaping Business Plan Template for Excel
$39
Landscaping Cash Flow Template for Excel
$29
Landscaping Expense Tracker Template for Excel
$29
Landscaping Financial Model Template for Excel
$29
Landscaping Income Statement Template for Excel
$29
Landscaping Invoice Template for Excel
$29
Landscaping KPI Dashboard Template for Excel
$29
Landscaping Pro Forma Template for Excel
$29
Landscaping Project Budget Template for Excel
$29
Landscaping Sales Forecast Template for Excel
$29
Landscaping Business Valuation Template for Excel
$29
Landscaping P&L Template
$29